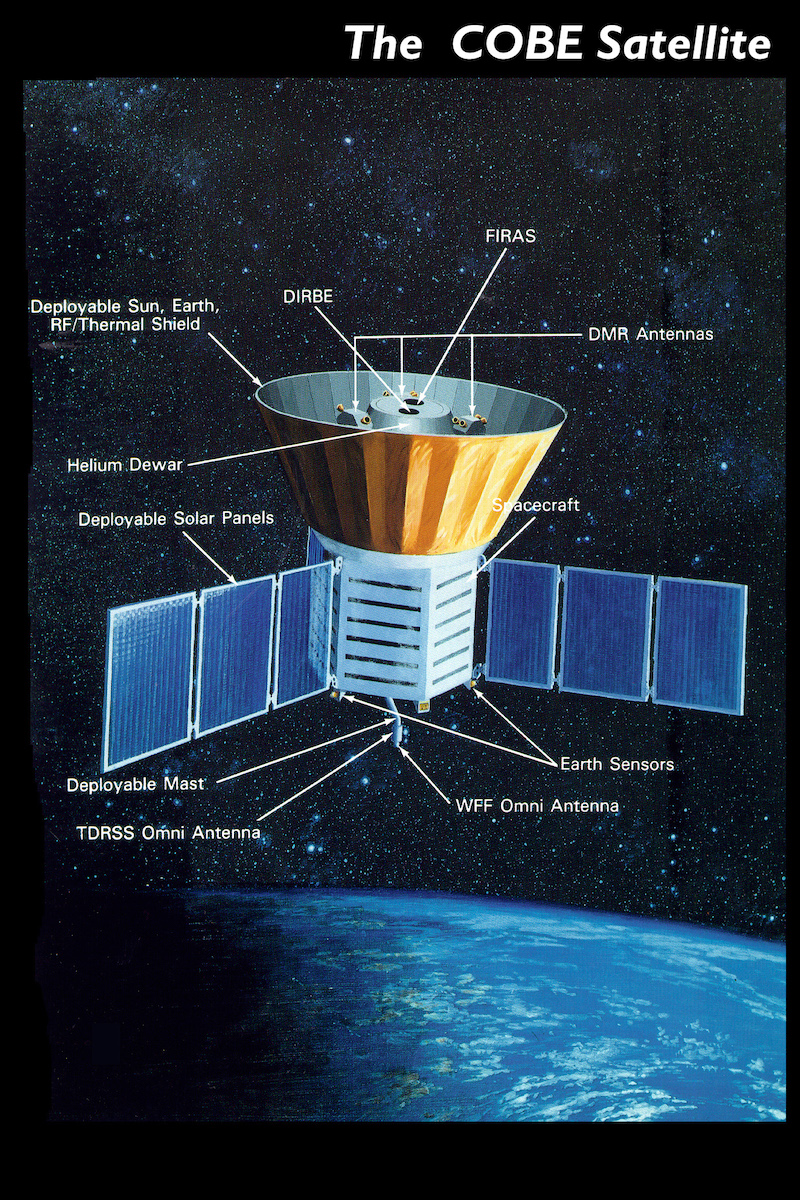
|
HPS 2580 |
Cosmology | Spring 2018 |
https://lambda.gsfc.nasa.gov/product/cobe/

Journal announcement of results:
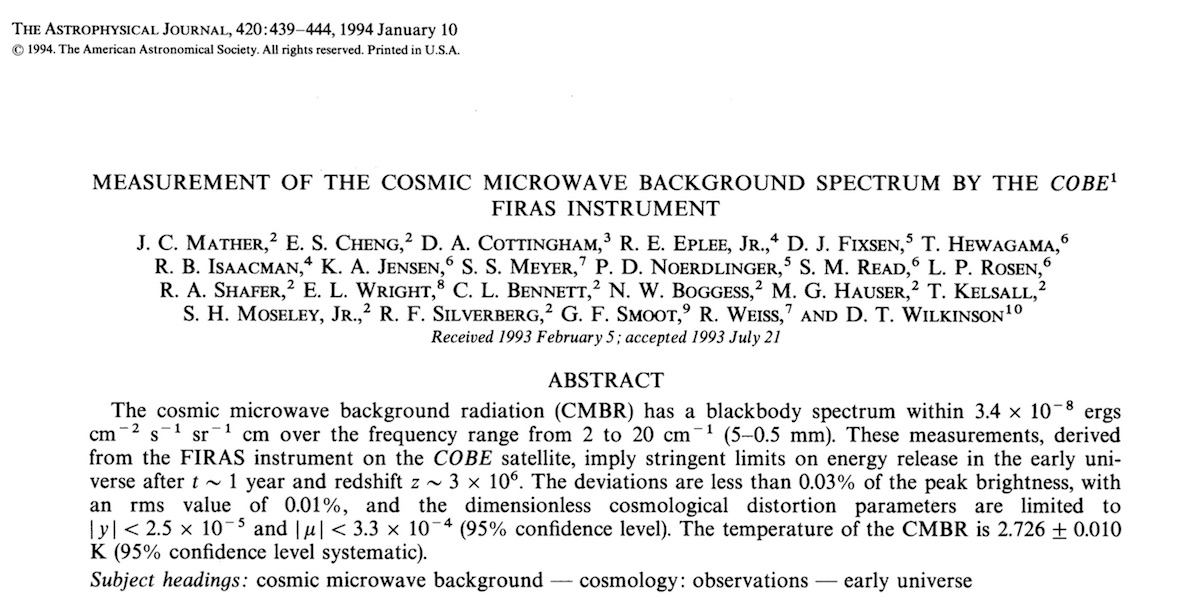
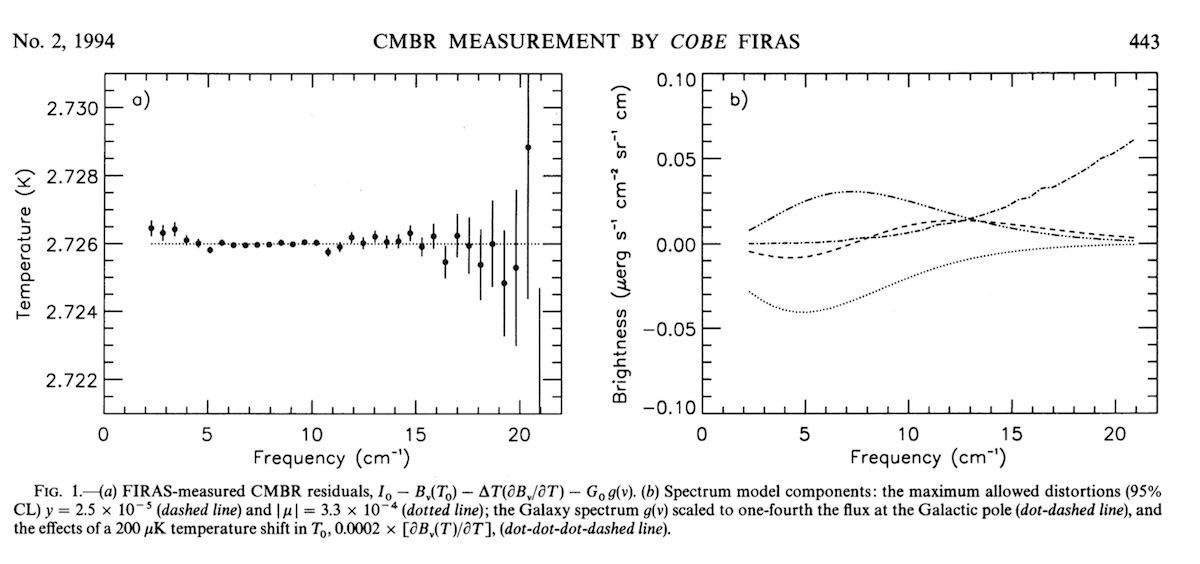
The journal plot of the blackbody spectrum
The popular plot:
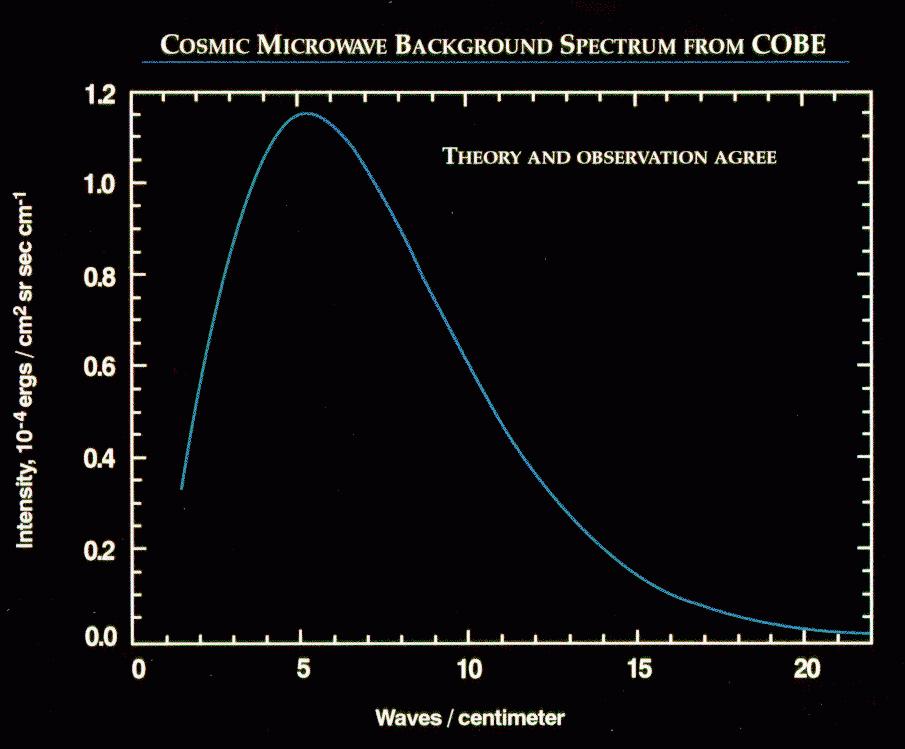
Remark at https://lambda.gsfc.nasa.gov/product/cobe/firas_image.cfm :
" The FIRAS data were taken at 43 positions equally spaced along this curve. The FIRAS data match the curve so exactly, with error uncertainties less than the width of the blackbody curve, that it is impossible to distinguish the data from the theoretical curve."
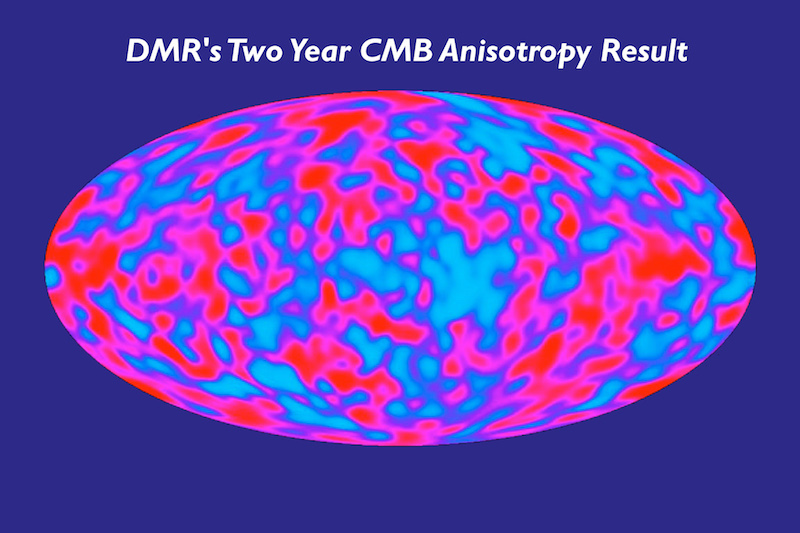
Anisotropy once all corrections are made:
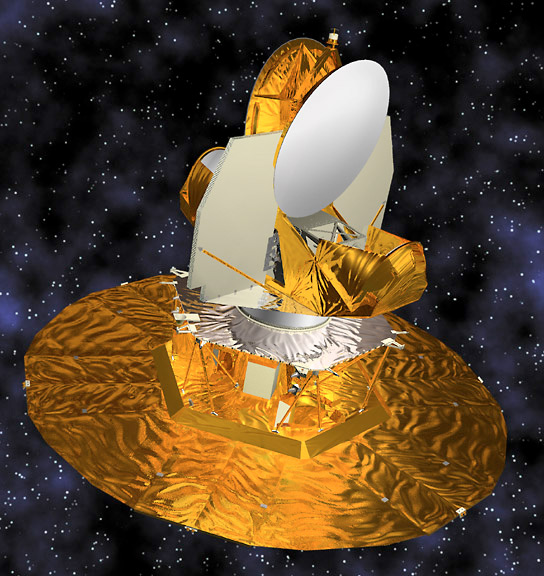
Paper announcing the final results:
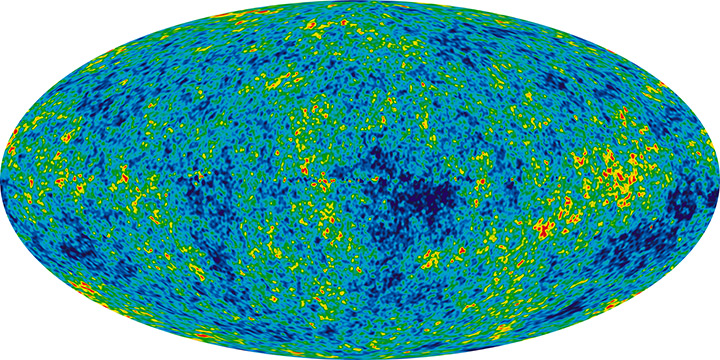
Anisotropy plot:
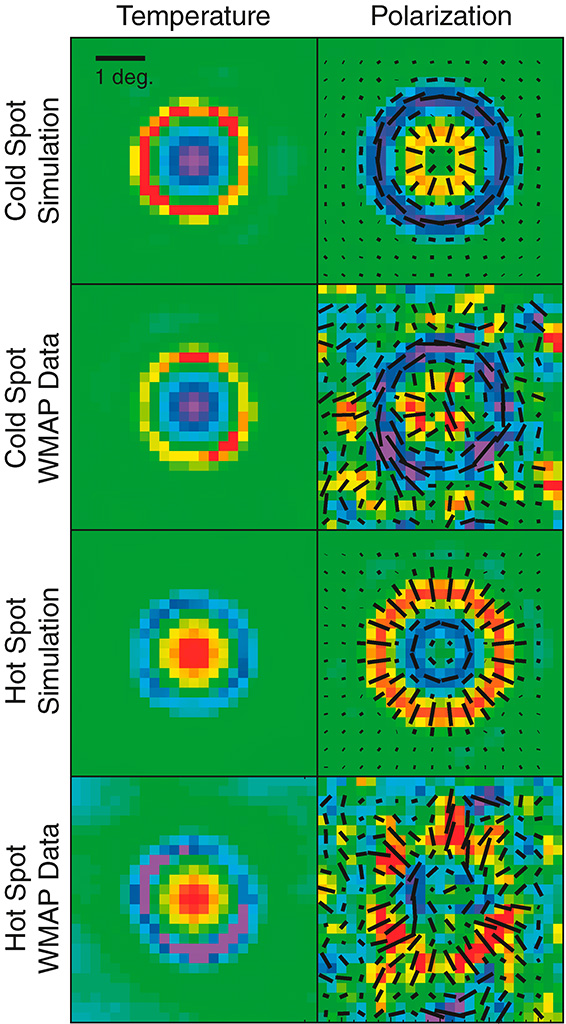
Detail of polarization plot:
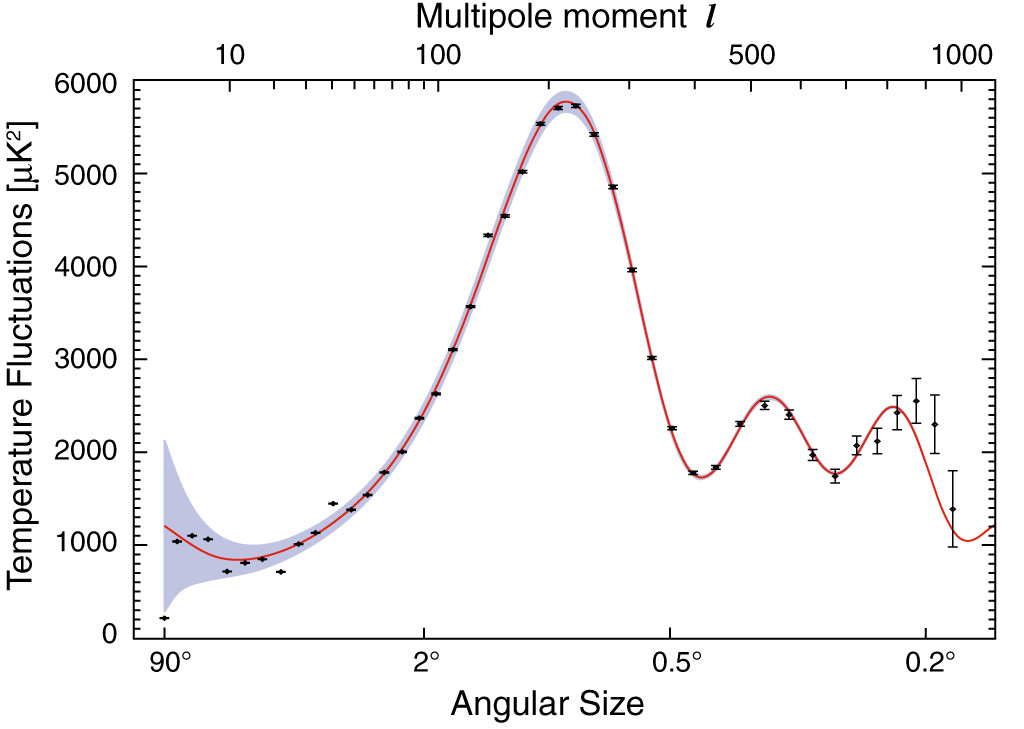
Power spectrum:
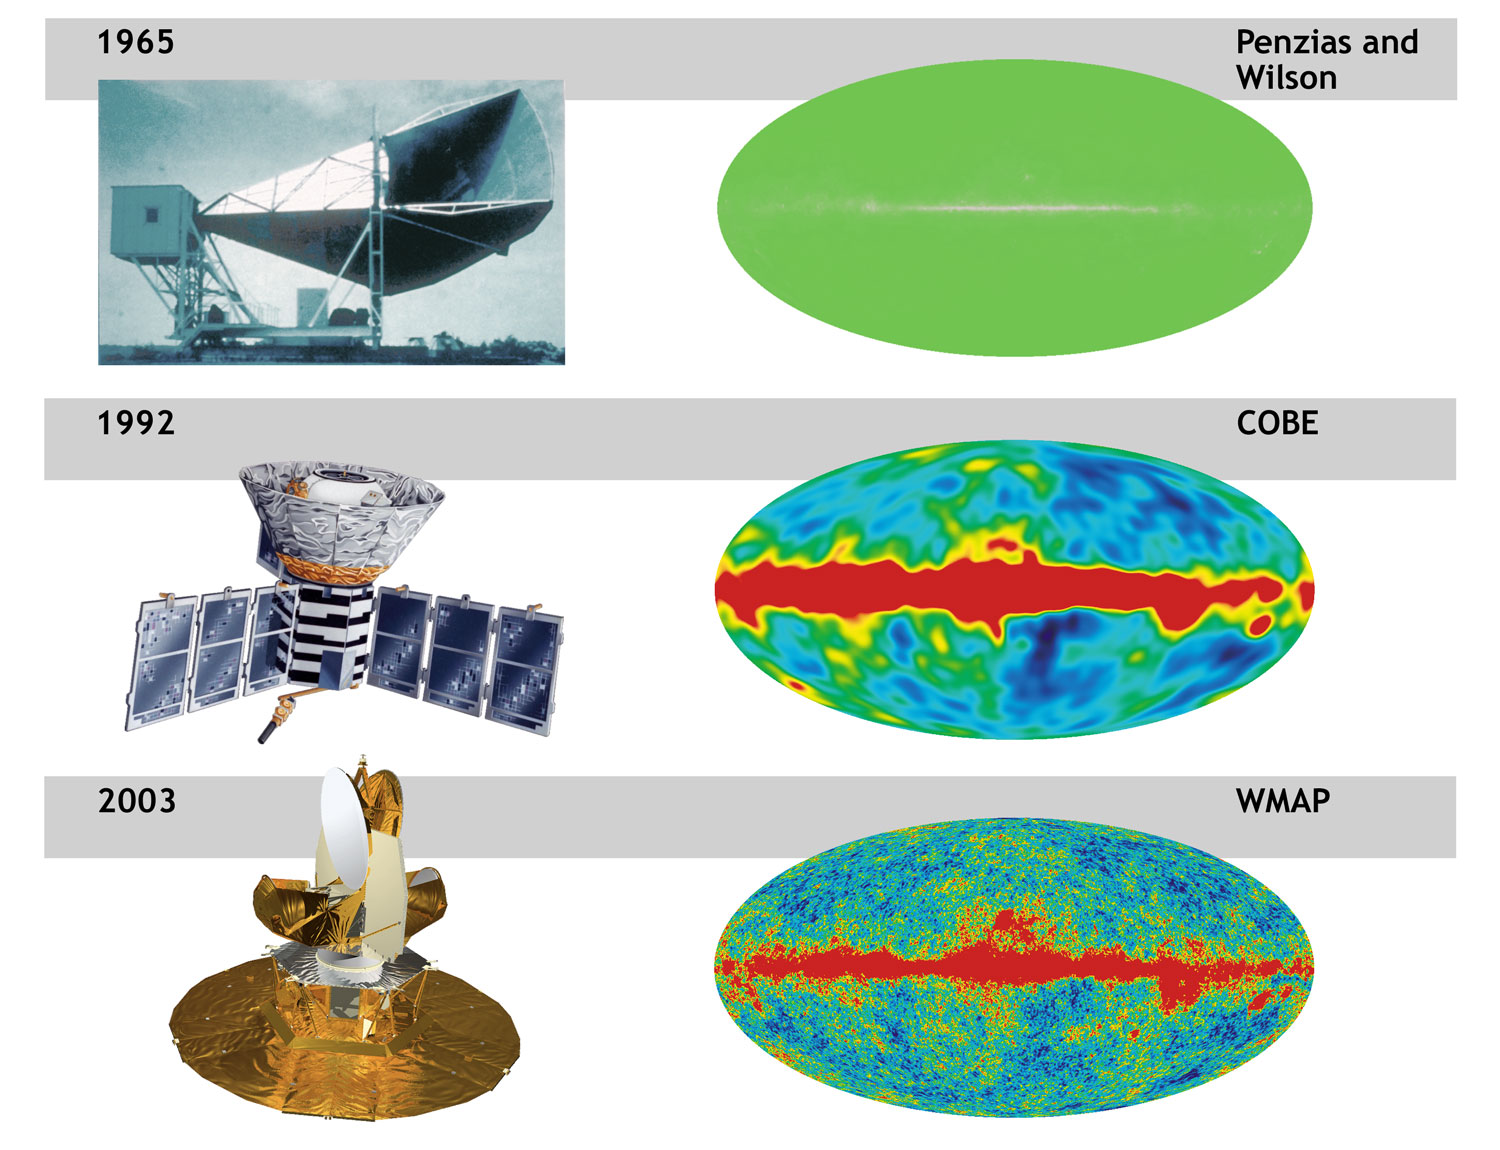
Comparison of resolution of Penzias and Wilson's horn, COBE and WMAP:
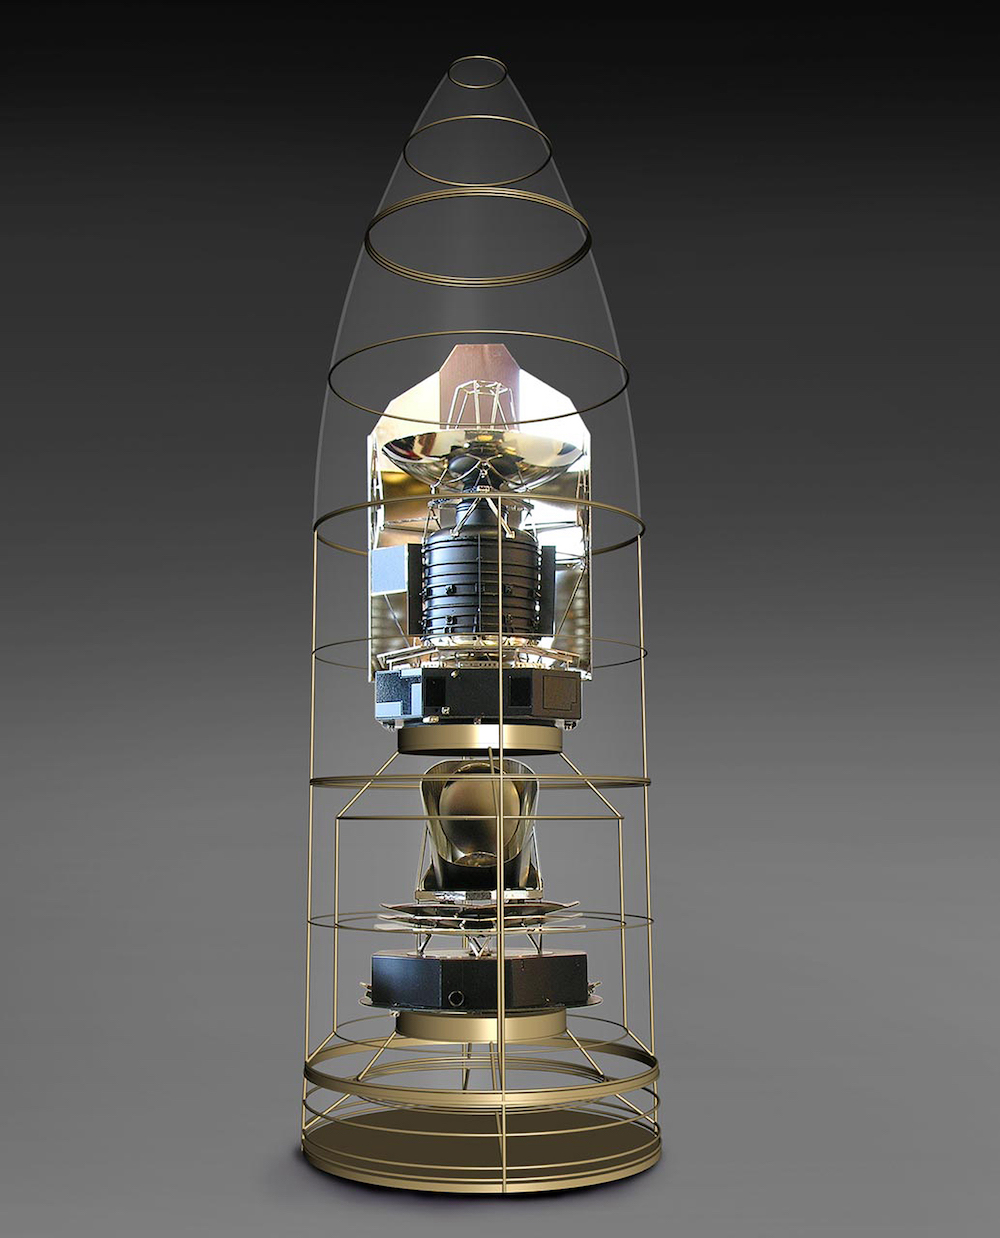
http://www.esa.int/Our_Activities/Space_Science/Planck
A principal paper:
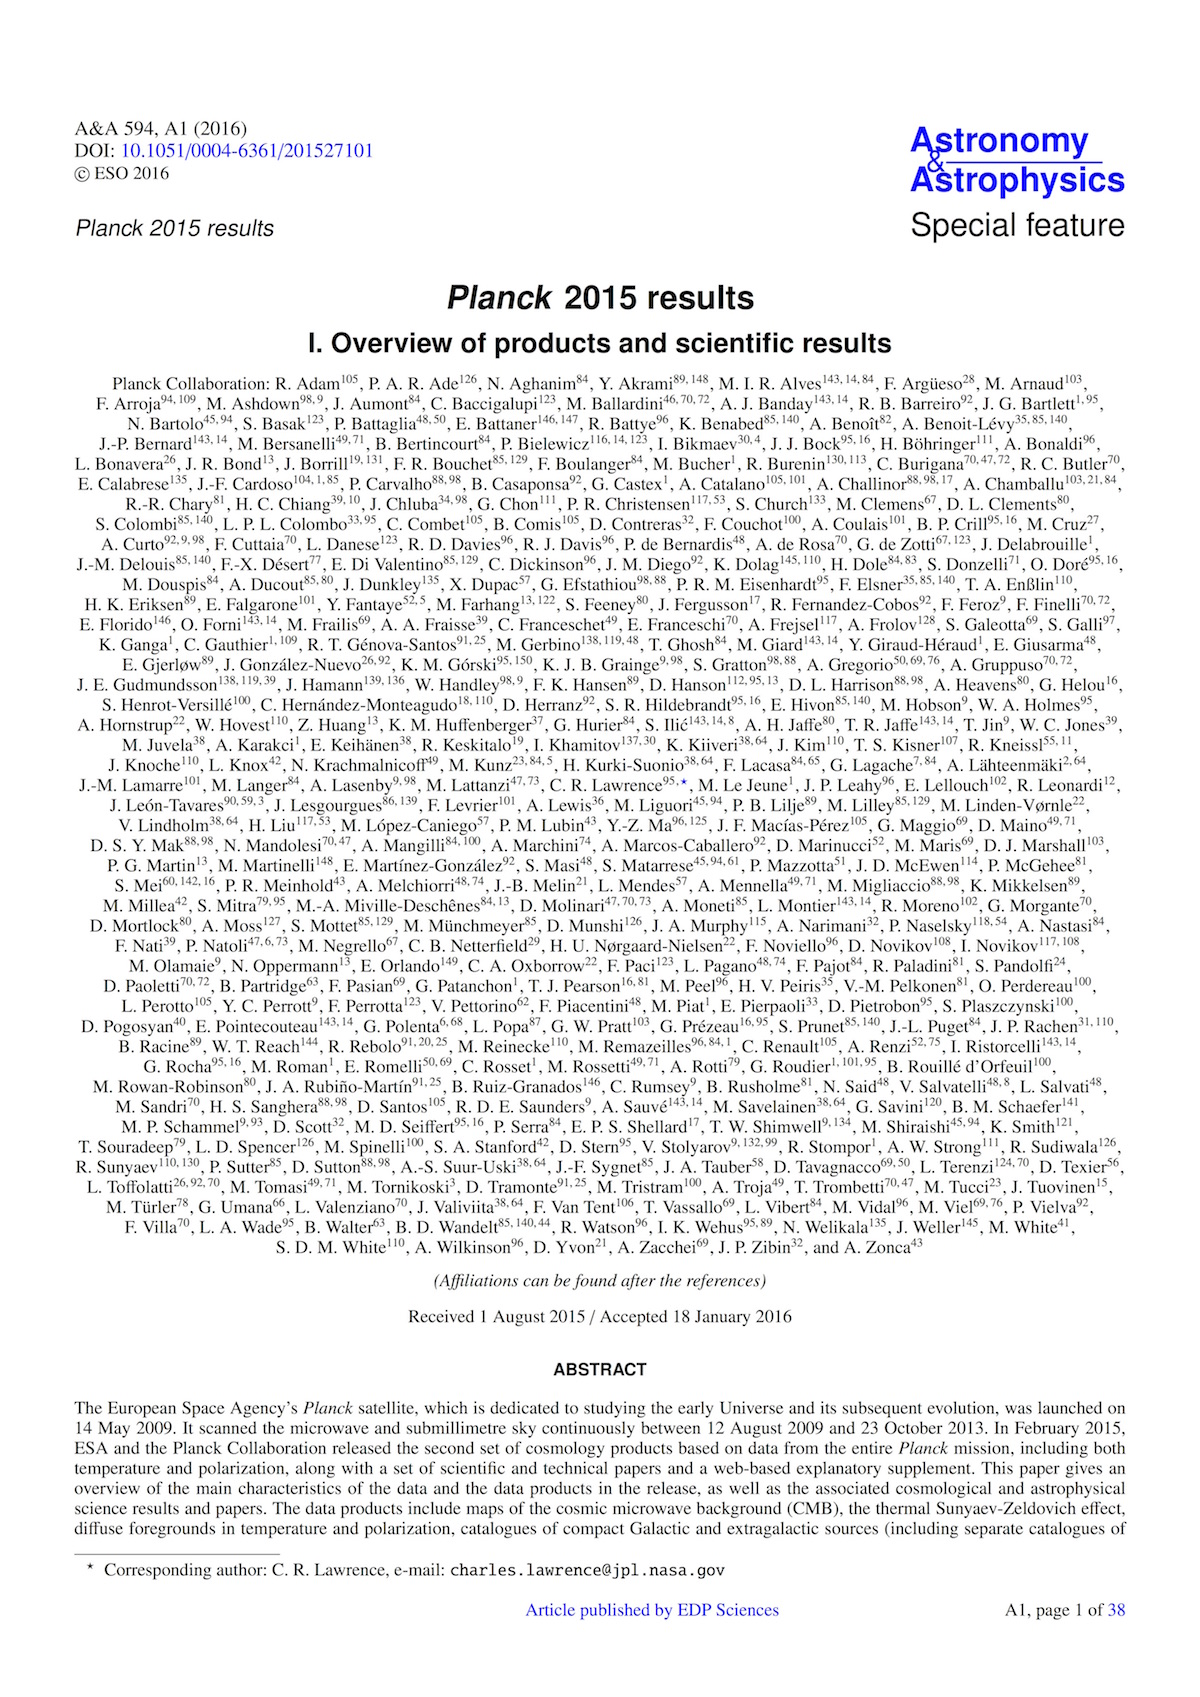
Anisotropy map:
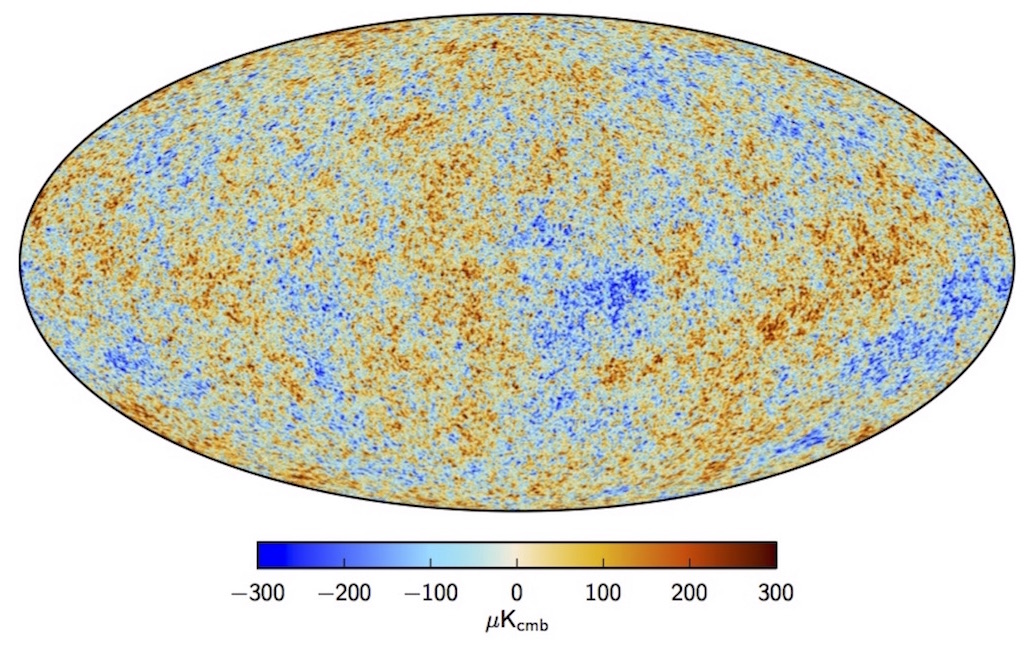
What happened to the band of the Milky Way galaxy?
"Maximum posterior CMB intensity map at 5′ resolution derived from the
joint baseline analysis of Planck, WMAP, and 408 MHz observations. A small
strip of the Galactic plane, covering 1.6% of the sky, is filled in by a
constrained realization that has the same statistical properties as the
rest of the sky."
https://www.aanda.org/articles/aa/full_html/2016/10/aa27101-15/F9.html
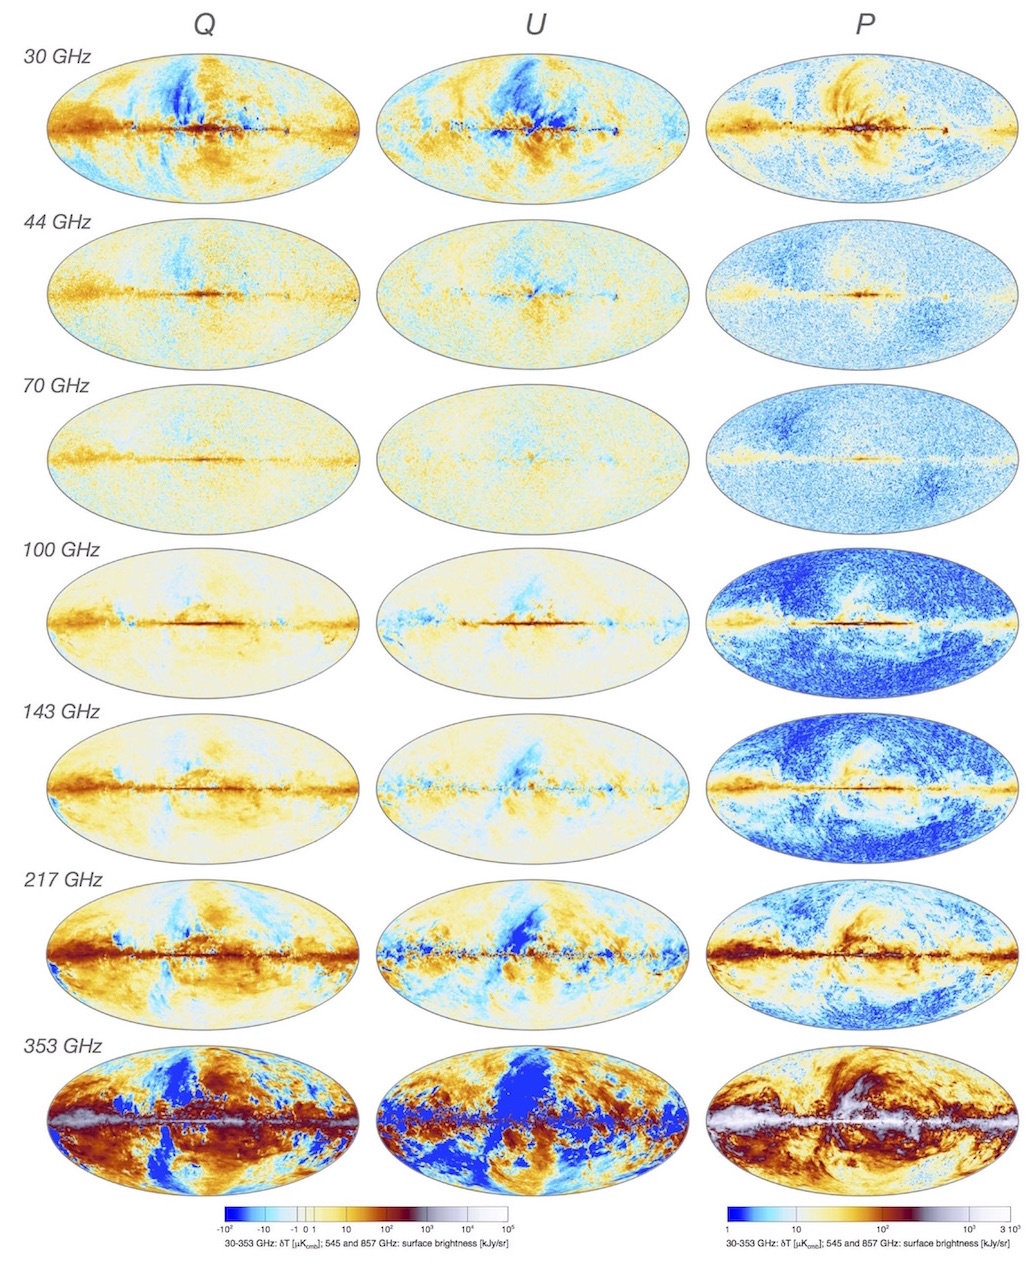
Polarization maps:
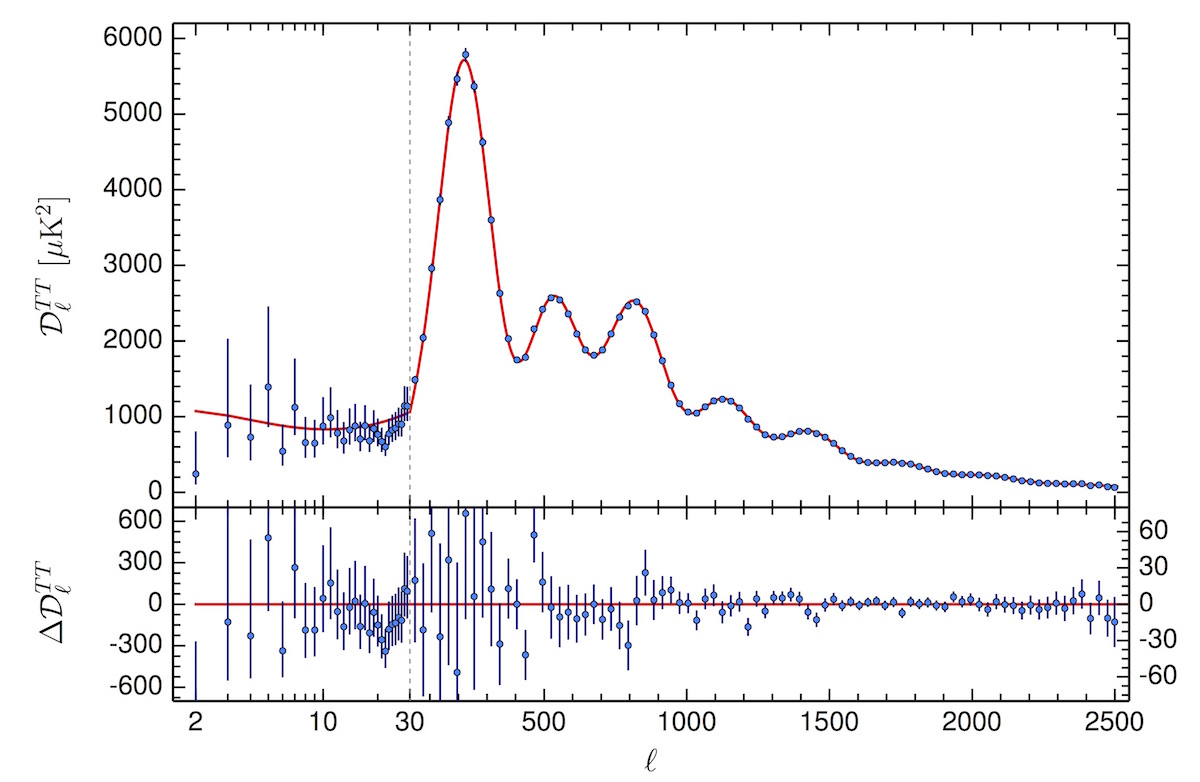
Power spectrum:
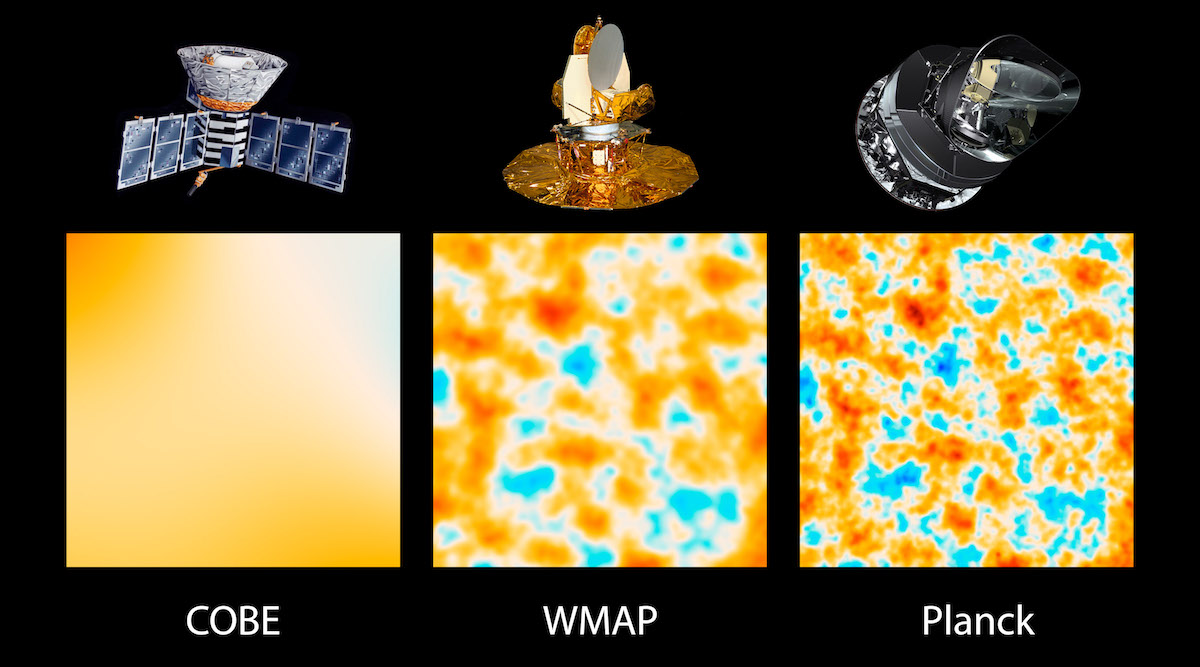
"The three panels show 10-square-degree patches of all-sky maps."
https://www.nasa.gov/mission_pages/planck/multimedia/pia16874.html
Image credit: NASA/JPL-Caltech/ESA