 |
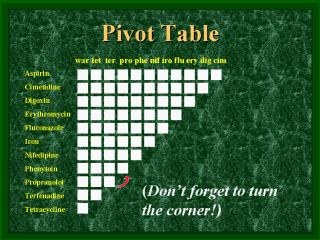
Next, one eliminates the
“overdose line” the diagonal that represents a drug interacting with itself, and one
is left with a neat chart of boxes which can contain potential drug interactions. Although
there is frequently more than one kind of drug interaction between any two given drugs,
there is usually one interaction that predominates. (On a practical note: when scanning a
pivot table which has been cut diagonally don’t forget to turn the corner when you get
to the end of a row…..you may miss most of the interactions!) |
