| front |1 |2 |3 |4 |5 |6 |7 |8 |9 |10 |11 |12 |13 |14 |15 |16 |17 |18 |review |
 |
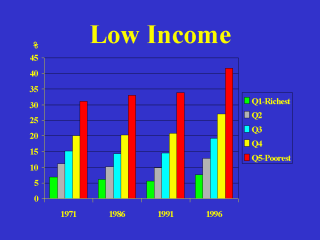
Within each
census metropolitan area, the census non-institutional population and deaths were grouped
into neighbourhood income quintiles based on census tract percentage of population below
Statistic Canada's low-income cut-offs, which vary by family size and are Canada's
unofficial "poverty lines." The cut-offs are regularly adjusted for inflation so they are now much higher than their US counterparts. The percentage poor in each quintile was fairly stable from 1971 to 1991—but it increased especially in the poorer quintiles from 1991 to 1996, which coincided with a period of increasing unemployment and greater income inequality in Canada. Note that relative rather than absolute income was used to define the quintiles—so fifths of the population ranked by income were compared, regardless of how income distribution changed over time. |