| front |1 |2 |3 |4 |5 |6 |7 |8 |9 |10 |11 |12 |13 |14 |15 |16 |17 |18 |19 |20 |21 |22 |23 |24 |25 |26 |27 |28 |29 |30 |31 |32 |33 |34 |35 |36 |37 |38 |39 |40 |41 |42 |43 |44 |45 |46 |47 |48 |49 |50 |51 |52 |53 |54 |55 |56 |57 |58 |59 |60 |review |
 |
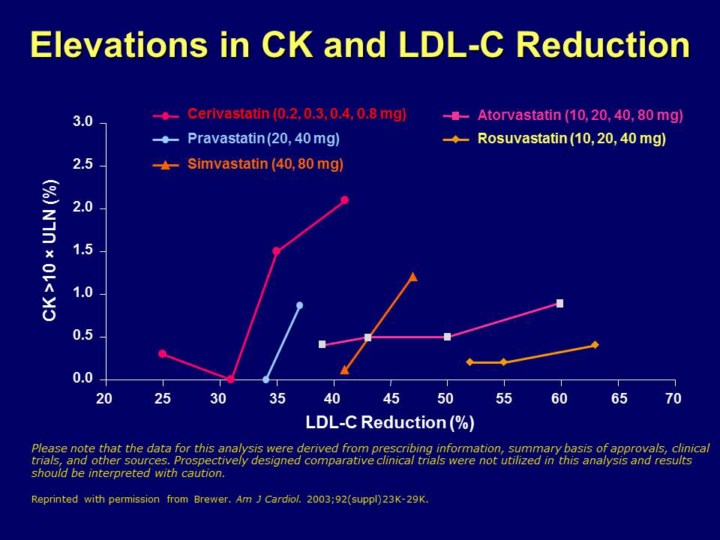
Key Point: The occurrence of clinically relevant CK elevations with greater LDL-C reductions is low in patients receiving rosuvastatin 10 mg to 40 mg, indicating a favorable benefit-risk profile. This slide shows a benefit-risk assessment for statin therapies. The occurrence of CK elevations >10 ´ ULN are plotted against percent LDL-C reductions for various statins by dose As shown, this graph suggests most of the statins exhibit an increasing occurrence of clinically relevant CK elevations with increasing LDL-C reductions as the dose is increased
However,
the occurrence of clinically relevant CK elevations with greater LDL-C
reductions remains low in patients receiving rosuvastatin 10 mg to 40 mg,
indicating a favorable benefit-risk profile
Please note that the data for this analysis were derived from prescribing
information,
|