| front |1 |2 |3 |4 |5 |6 |7 |8 |9 |10 |11 |12 |13 |14 |15 |16 |17 |18 |19 |20 |21 |22 |23 |24 |25 |26 |27 |28 |29 |30 |31 |32 |33 |34 |35|36 |37 |38 |39 |40 |41 |42 |43 |44 |45 |46| |
 |
If you have any comments or questions, please send a
message to
super1@pitt.edu
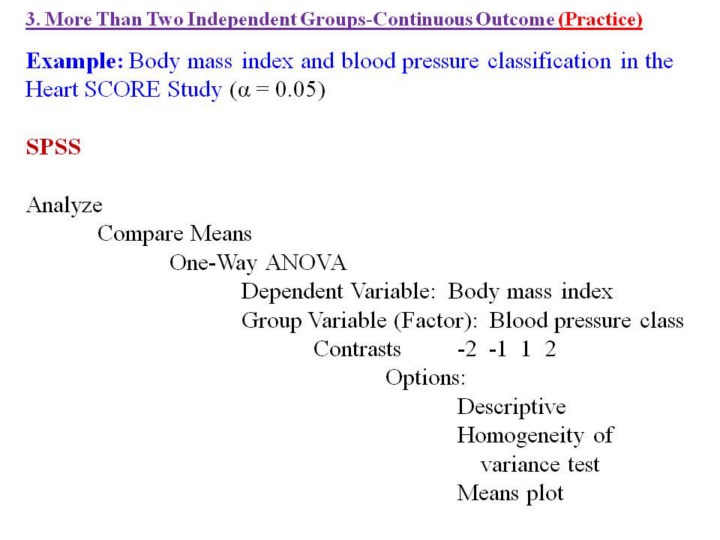
1.Here
are the interactive steps used in SPSS to compare a continuous outcome
variable based on an independent group design with more than 2 groups.
2.The
“Contrasts” coding compares mean values in an “ordered” manner across
the 4 categories of blood pressure classification.
Go to part 2 of this lecture - http://www.pitt.edu/~super1/lecture/lec51751/index.htm
|
Search inside of Supercourse and lectures in HTML or PPT format