| front |1 |2 |3 |4 |5 |6 |7 |8 |9 |10 |11 |12 |13 |14 |15 |16 |17 |18 |19 |20 |21 |22 |23 |24 |review |
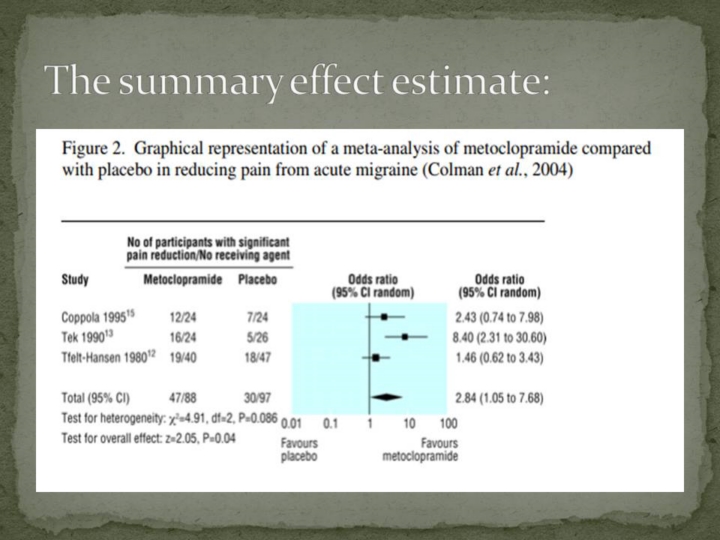 |
This is an example of a forest plot, which represents a summary effect estimate. It is called a forest plot, because the vertical line are thought to resemble trees in a forest. See please all sections of this graph, a lot of videos can be seen to explain how to read a forest plot. |