|
The
Process - ECG Interpretation
From the AHA Arrhythmia Media Library link, you can explore a wide
variety of visual images and text related to cardiac topics.
http://watchlearnlive.heart.org/CVML_Player.php?moduleSelect=arrhyt

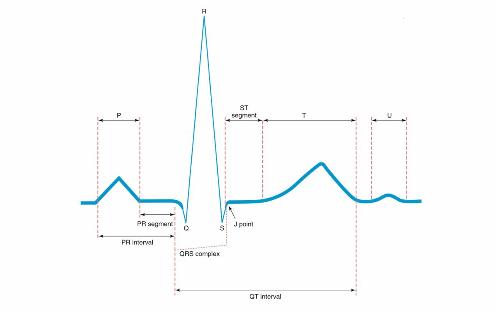
Isoelectric
Line
Straight
line seen when no electrical activity occurs.
The baseline of the tracing.
P wave
Represents
atrial depolarization.
Impulse fired from SA node and spreads through atrial tissue.
Usually upright and rounded.
P-R Interval
The time
required for the impulse to travel through the atria to A-V
node.
0.12 - 0.20 seconds
Measured from beginning of P wave to beginning of QRS complex.
QRS Complex
Represents
ventricular depolarization.
0.06 - 0.08 seconds
Measured from beginning of Q wave to end of S wave.
J-Point
Represents
junction where QRS complex ends and ST segment begins.
S-T Segment
Represents
time interval between completion of ventricular depolarization
and onset of ventricular repolarization.
Measured from the end of QRS complex to beginning of T wave.
Q-T Segment
Represents
the time required for ventricles to depolarize and repolarize.
0.32 - 0.40 seconds
Measured from onset of QRS complex to end of T wave.
T wave
Represents
ventricular repolarization.
Usually same deflection as QRS complex.
U wave
Represents
late ventricular repolarization.
Small, usually positive deflection following the T wave
Uncertain significance - typically seen with hyokalemia
Electrocardiogram
Primer video: A weblink to view an ECG video
http://www.hhmi.org/biointeractive/echocardiogram
|

