 This is the command window for XPPAUT. Click for a fullsize image.
This is the command window for XPPAUT. Click for a fullsize image.
 The data
viewer, equation window, initial data window, and parameter window.
The data
viewer, equation window, initial data window, and parameter window.
 AUTO Window
 |
 |

An integrable system colored according to energy levels.

The famous Lorenz equations projected along the coordinate axes. Click here to see it rotate.


An animated Julia set for the complex quadratic map and of course the associated Mandelbrot set

The basins of attraction for the solutions to Newton's method applied to the cube roots of unity.

Linearly coupled pendula with no friction.

Class IV cellular automata. Download the table ca5.tab before running ca100.ode
The Grey-Scott PDE using the method of lines and the integrator CVODE.
 |
Here is the
simple undamped pendulum rendered with
the animation file.
|
 |
This is a
double pendulum rendered with
the animation file.
$nbsp; |
 |
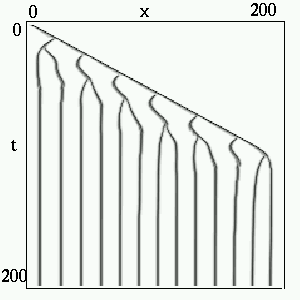
Here is another way to look at the
Grey-Scott equations rendered with
the animation file. The curves
represent the spatial profiles as of the two chemical species. |
 |
This shows the evolution of the relative phases for a 6x6 array of weakly
coupled oscillators rendered with
this animation file. The oscillators are
nearly locked and have crossed a saddle-node bifurcation. Integrate
for 80 time units and look at x33 drift.
|
 |
This is a model for a waterwheel with
10 cups. In the limit as the number of cups goes to infinity, the
behavior is modeled by the Lorenz equations. This cartoon is rendered
by this animation file.
|