| front |1 |2 |3 |4 |5 |6 |7 |8 |9 |10 |11 |12 |13 |14 |15 |16 |17 |18 |19 |20 |21 |22 |23 |24 |25 |26 |27 |28 |29 |30 |31 |32 |33 |34 |35 |36 |37 |38 |39 |40 |41 |42 |43 |44 |45 |46 |47 |48 |49 |50 |51 |52 |53 |54 |55 |review |
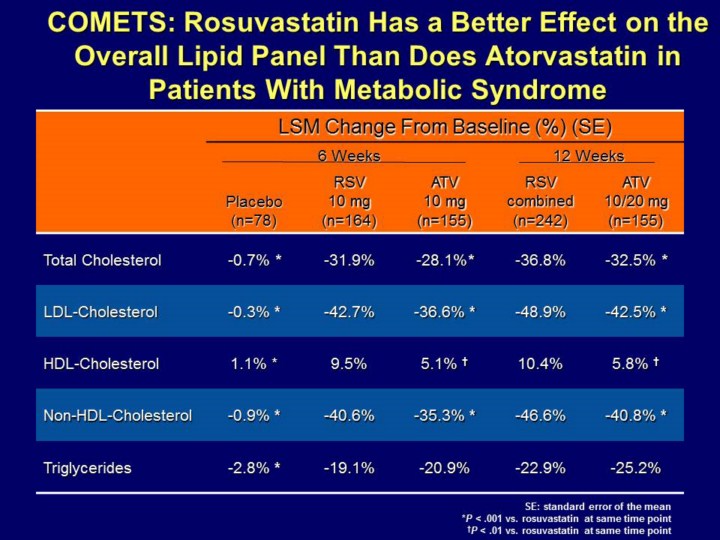 |
The changes in total cholesterol, HDL-C, TG and non-HDL-C from baseline at 6 and 12 weeks with rosuvastatin and atorvastatin treatment are displayed in the current slide.
Changes in total cholesterol, LDL-C, HDL-C, and non-HDL-C from baseline were significantly greater in the rosuvastatin group when compared with the atorvastatin group at 6 and 12 weeks (P< 0.01). Reductions in TG were similar in the rosuvastatin and atorvastatin groups.1.
By 12 weeks, HDL-C increased by 10.4% with rosuvastatin when compared with 5.8% with atorvastatin (P<0.01).1
Reference: 1. Stalenhoef AFH, et al. A COmparative study with rosuvastatin in subjects with METabolic Syndrome: results of the COMETS study. Eur Heart J. 2005;26: 2664–2672.
|