| front |1 |2 |3 |4 |5 |6 |7 |8 |9 |10 |11 |12 |13 |14 |15 |16 |17 |18 |19 |20 |21 |22 |23 |24 |25 |26 |27 |28 |29 |30 |31 |32 |33 |34 |35 |36 |37 |38 |39 |40 |41 |42 |43 |44 |45 |review |
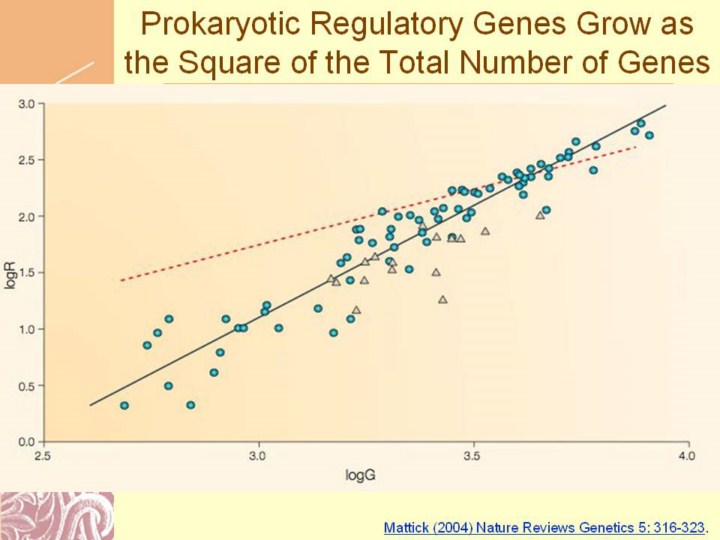 |
Mattick (2004) Nature Reviews Genetics 5: 316-323
Double-logarithmic plot of the number of genes that encode regulatory proteins (R) against the total number of genes (G) for bacteria (circles) and archaea (triangles).The log–log distribution is well described by a straight line with slope 1.96 ±0.15 (95% confidence interval), corresponding to a quadratic relationship between regulator number and total gene number (note that if R = ANx, a log transformation yields logR = xlogN + logA, in which the slope of the resulting line is equal to the exponent x). Dashed lines show the best linear fit to the data. Modified from REFS 18,19. |