| front |1 |2 |3 |4 |5 |6 |7 |8 |9 |10 |11 |12 |13 |14 |15 |16 |17 |18 |19 |20 |21 |22 |23 |24 |25 |26 |review |
 |
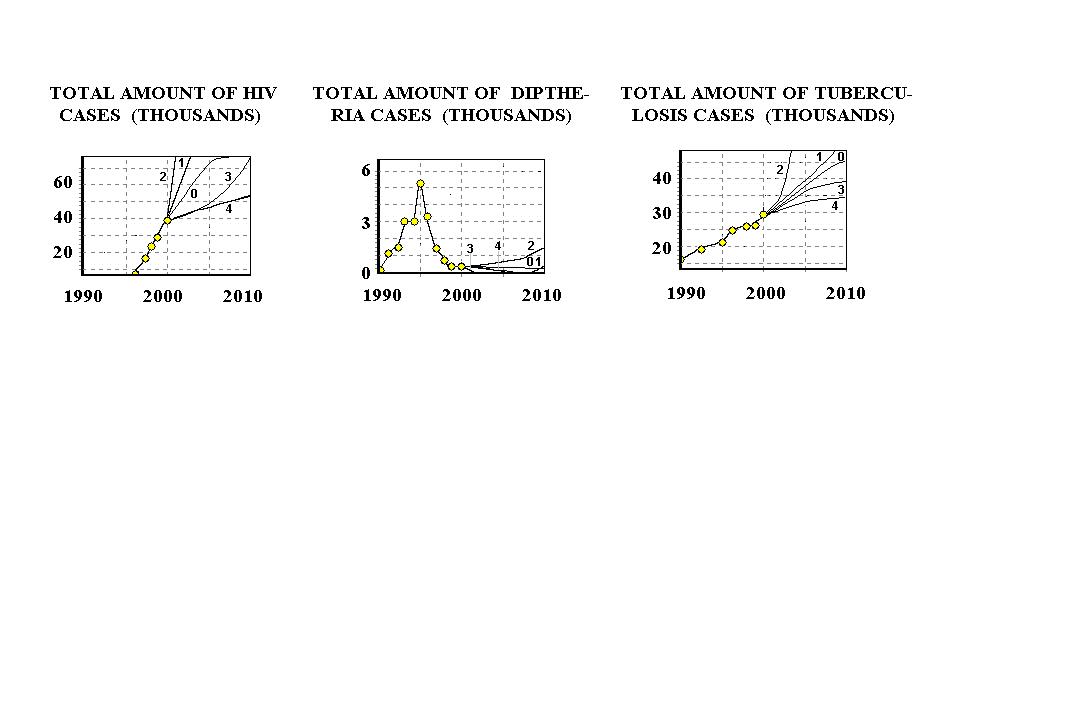
Figure 2 In figure 2 the results of some infectious disease dynamics forecasting are presented. The circles represent the real data for Ukraine. The curve 0 corresponds to solution of dynamic task at fixed control influences. The curves 1-4 accordingly represent solution of following optimization tasks: 1 - minimization of epidemic risk and maximization of life quality; 2 - minimization of epidemic risk and maximization of life quality and GNP; 3 - minimization of epidemic risk and pollution, maximization of life quality and GNP; 4 - minimization of epidemic risk, pollution, mortality level and maximization of life quality and GNP |