| front |1 |2 |3 |4 |5 |6 |7 |8 |9 |10 |11 |12 |13 |14 |15 |16 |17 |18 |19 |20 |21 |22 |23 |24 |25 |26 |27 |28 |29 |30 |31 |32 |33 |34 |35 |36 |37 |38 |39 |40 |41 |42 |43 |44 |45 |46 |47 |48 |49 |50 |51| 52 |53 |54 |55 |review |
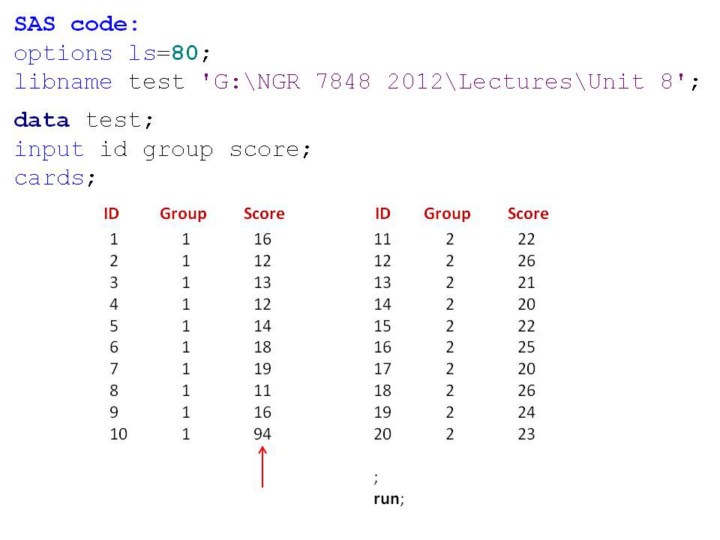 |
1.Here
is some sample SAS code for 2 groups of persons, each with 10
observations for a continuous variable.
2.Note
that group 1 has all “low” values between 11 and 19 except for one very
extreme value of 96, whereas group 2 has all “high values” between 20
and 26, yet no extreme values.
3.Thus,
group 2 has many more persons with high values than group 1.
|