| front |1 |2 |3 |4 |5 |6 |7 |8 |9 |10 |11 |12 |13 |14 |15 |16 |17 |18 |19 |20 |21 |22 |23 |24 |25 |26 |27 |28 |29 |30 |31 |32 |33 |34 |35 |36 |37 |38 |39 |40 |41 |42 |43 |44 |45 |46 |47 |48 |49 |50 |51 |52 |53 |54 |55 |review |
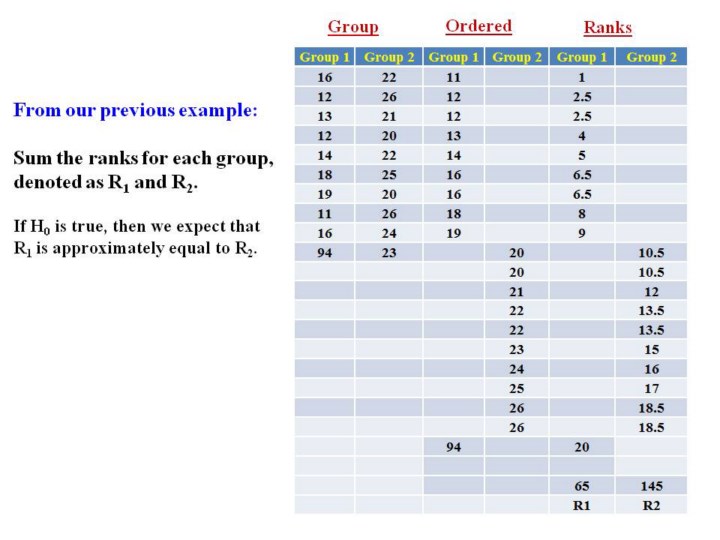 |
1.Here
we are using data from our previously example where group 2 tended to
have higher values than group 1, but group 1 had one extreme value.
2.Note
that we have ordered and ranked each value for the 2 groups, and then
summed the ranks for the 2 groups denoted as R1 and R2.
3.As
seen, group 2 has a much greater sum with R2=145 compared to group 1
where R1=65.
|