| front |1 |2 |3 |4 |5 |6 |7 |8 |9 |10 |11 |12 |13 |14 |15 |16 |17 |18 |19 |20 |21 |22 |23 |24 |25 |26 |27 |28 |29 |30 |31 |32 |33 |34 |35 |36 |37 |38 |39 |40 |41 |42 |review |
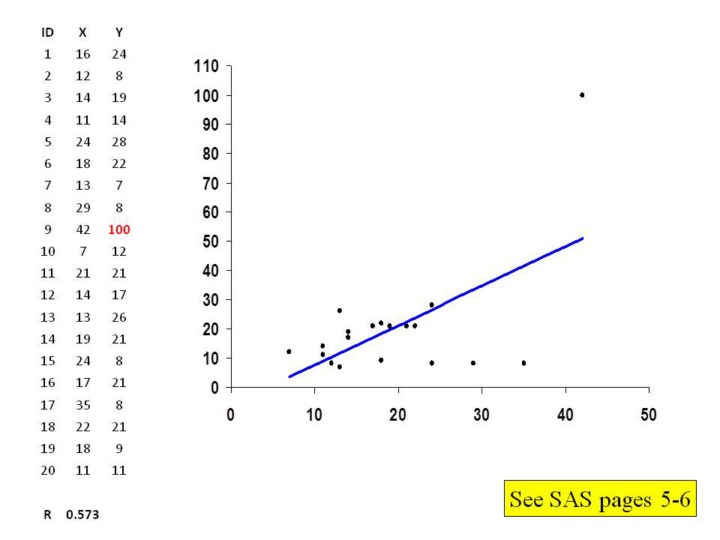 |
1.Now
let’s take a look at
happens when we change just one value, for ID #9, to have an extreme “y”
score of 100.
2.You
will notice that the shape of the regression line has changed, and the
correlation coefficient of 0.57 is now much higher.
3.As
seen in your SAS handout, the correlation is now statistically
significant.
|