| front |1 |2 |3 |4 |5 |6 |7 |8 |9 |10 |11 |12 |13 |14 |15 |16 |17 |18 |19 |20 |21 |22 |23 |24 |25 |26 |27 |28 |29 |30 |31 |32 |33 |34 |35 |36 |37 |38 |39 |40 |41 |42 |review |
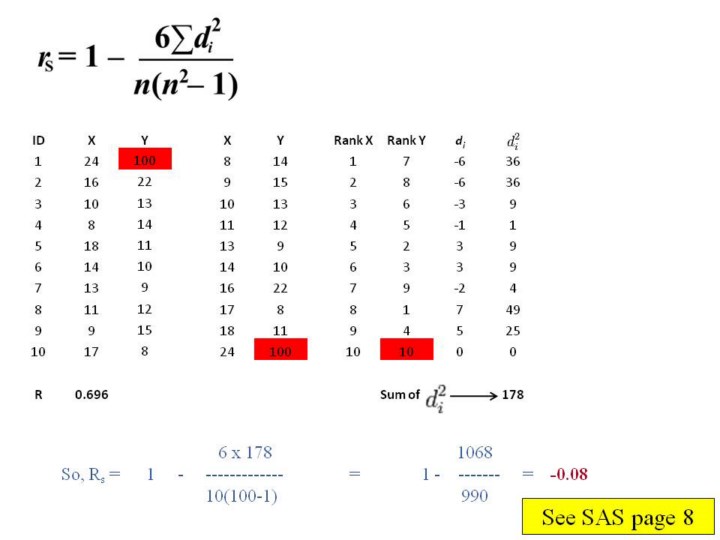 |
1.We
have not “ranked” the scores for the “x” and “y” values to remove
the influence of the extreme value for ID #1.
2.Notice
with the Spearman method, the correlation coefficient is now -0.08, much
different than the Pearson calculation.
3.Refer
to your SAS handout for review the syntax.
|