| front |1 |2 |3 |4 |5 |6 |7 |8 |9 |10 |11 |12 |13 |14 |15 |16 |17 |18 |19 |20 |21 |22 |23 |24 |25 |26 |27 |28 |29 |30 |31 |32 |33 |34 |35|36 |37 |38 |39 |40 |41 |42 |43 |44 |45 |46 |47 |48 |49 |50 |51 |52 |53 |54 |55 |56 |57|58 |59 |60 |61 |62|63 |64 |review |
 |
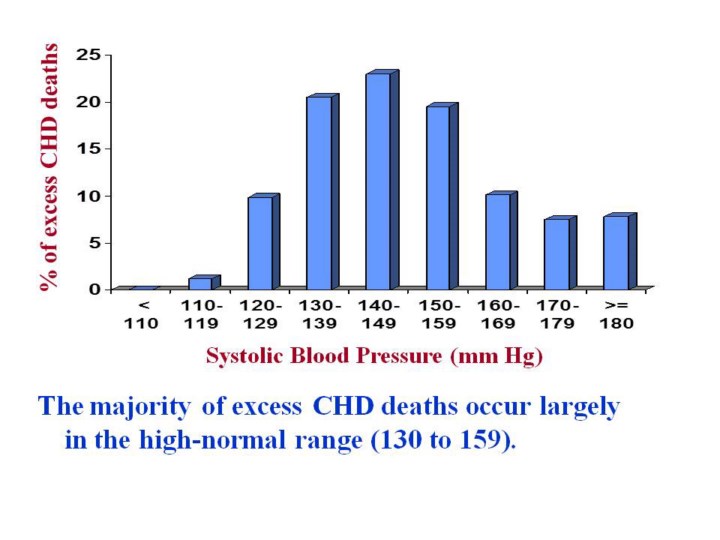
1.As
seen on this graph, most of the excess deaths from coronary heart
disease occurs among persons with systolic blood pressure in the
high-normal range.
2.This
is because a large percentage of the population has systolic blood
pressure level in this range, which is associated with modestly
increased risk of mortality.
|