

Research:
Navigation:Home Page
Research
Supernovae
|
Overview:
|
|
Wolf-Rayet stars were first identified in 1867 by C.J.E. Wolf and G. Rayet. Unlike most stars, which have narrow absorption line spectra, the spectra of Wolf-Rayet stars are characterized by broad emission lines. W-R stars, are subdivided into 3 broad spectroscopic classes based on the emission lines present in their spectra: WN (helium and nitrogen lines), WC (helium and carbon) and WO (helium, carbon, and oxygen). Population I W-R stars are generally located in the spiral arms of our galaxy near H II regions. With masses ranging from 5 to 60 times that of our own Sun, they are believed to be descended from O stars. Surface temperatures may range from 25,000 K to 100,000 K, and thus W-R stars are significantly hotter than the Sun. Significant mass-loss, which may cause the star to lose over half its mass during its lifetime, is one of the defining characteristics of W-R stars. This mass loss occurs via stellar winds and strongly affects the stellar evolution of a star. It is believed to be driven by radiation pressure. Approximately 220 W-R stars have been found in the Milky Way, and others have been found in the Large and Small Magelenic Clouds and several other galaxies, including M31, M33, and NGC 6822. Although they are rare, W-R stars are very important. All stars more massive than 25 M? will pass though a W-R phase. In addition, Wolf-Rayet stars and their progenitors have an important influence on the chemical evolution, energetics, and dynamics of the inter stellar medium, or ISM.
Download encyclopedia article on Wolf-Rayet Stars.
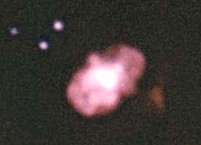
NGC2359, a ring nebula found in the constellation of Canis Majoris, surrounds the Wolf-Rayet Star HD 56925.
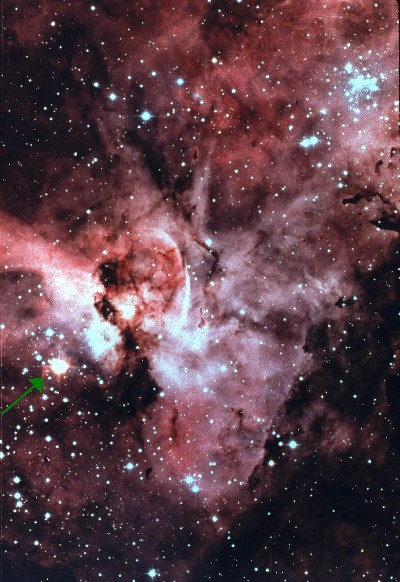
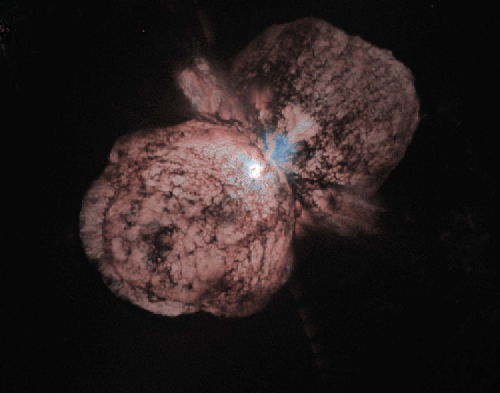
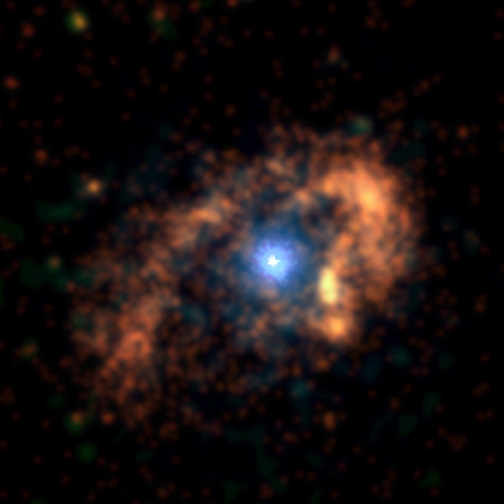
With a mass of over 100 times that of the sun, Eta Carinae is the most massive and most luminous star in the galaxy. It emits 5 million times more energy than the Sun! Due to its enormous mass, it will end its life in a spectacular supernova explosion. In the 1840's it underwent a major eruption, and a smaller eruption occurred during the 1890s. Minor spectroscopic events occur every 5.5 years, with the next minor outburst occurring in July 2003. During the spectroscopic event high excitation nebular lines, seen in ground base spectra, weaken significantly. Initially, the X-ray flux rises, but then drops to very low levels. The simplest explanation for the variability is that Eta Carinae is a binary system, with a 5.5 year period. Due to the short duration of the spectroscopic event, the companion must orbit the primary star in a highly elliptical orbit. An extensive observing campaign at X-ray, UV, optical, infrared, and radio wavelengths will monitor the event. It is hoped that these observations will lead to a better understanding of this peculiar star, and the causes of its major outbursts. The major outbursts are spectacular events --- during the 1840 outburst several solar masses of material were ejected from the star, and the luminosity of Eta Carinae rivaled that of a supernovae.
Click on each image for a larger version and more information:
 |
 |
 |
 |
| Anglo Australian Observatory | STScI, Jon Morse | Anglo Australian Observatory | NASA / Chandra Project 1999 |
More information on Eta Carinae:
Augusto Damineli's website includes images of Eta Carinae, information on the 2003 event, and other facts about Eta Carinae.
Dr. Mike Corcoran: X-ray observations of Eta Carinae.
Stephen White: Radio variability.
Kris Davidson's: General information on Eta Carinae, including the 2003 event and the HST Treasury Project.
Radiative Transfer and Spectroscopic Modeling:
For many stars it is feasible to perform
quantitative spectroscopic analyses using atmospheric models based on the
assumption of Local Thermodynamic Equilibrium (LTE). That is, we assume that at
each depth the populations of different atomic energy levels are determined
solely by the local gas density and temperature.
Unfortunately the assumption of LTE is untenable for hot stars, novae,
supernovae, and stars with low density atmospheres. In these objects radiative
processes dominate over collisional processes, and the populations of individual
atomic and ionic levels are strongly coupled to the radiation field which may be
characterized by a temperature vastly different from the local electron
temperature. In such cases it is necessary to solve the statistical equilibrium
equation in conjunction with the radiative transfer equation. Because we must
determine the populations of thousands of atomic levels at each depth in our
model atmosphere, because we need to solve the
radiative transfer equation at thousand of frequencies, and because of the
complex interaction between the level populations and the radiation field, the
construction of reliable model atmospheres is extremely difficult. Until
recently, non-LTE model atmospheres were much less `sophisticated' than the best
LTE model atmospheres.
With the advent of new techniques, and increased computational power, codes such
as CMFGEN are now capable of modeling the complex spectra of massive stars.
The polarization of light is a important diagnostic tool in astronomy.
Polarization studies can be used to investigate the distribution of matter
around stars, to derive mass-loss rates, as well as place constraints on
magnetic field strengths. I have developed several computer programs to model
polarized line profiles produced by electrons scattering in expanding
axisymmetric envelopes.
Using these code, and an additional code developed by a former graduate student
(Ryuchi Kurosawa) we have studied both single W-R stars and binary W-R stars.
For example, we have have analyzed the single WC5 star HD 165763. This star
shows no polarization, and because of the flat topped profiles, strong
constraints can be placed on the envelope asymmetry. We have also successfully
modeled the polarized spectrum of the WN+O binary star V444 Cygni, allowing an
accurate mass-loss rate to be derived.
CMFGEN is being used to model the light curves and spectra of supernovae (SN), and
has been used successfully to model Type Ia, Type Ib, Type Ic, Type II, and Type IIn SN.
Typically we commence our modeling utilizing results from a hydrodynamic simulation of
the SN explosion and which has traced the earliest epochs of the expansion — at later
times the SN ejecta expands freely (homologous expansion). With an initial model we perform
a sequence of non-LTE time-dependent radiative transfer calculations covering a few hundred days.
By comparing model light curves and spectra with observations we constrain properties of the
progenitor, derive abundances of atomic species (both pre-supernova and those created in the
explosion), and gain crucial insights into the explosion.
Supernovae are classified according to the presence or absence of hydrogen emission lines in their spectra. Type II SN show hydrogen lines in their spectra while Type I SN do not. Supernovae are responsible for most of the elements (excluding hydrogen and helium) in the Universe. Without supernovae we would not exist. Most of the atoms inside our bodies were once inside a star that exploded as a SN.
Type Ia SN are thought to arise from the explosion of a white dwarf star which is near the Chandresekhar limit of 1.4 solar masses, or from an explosion triggered by the merger of two white dwarf stars. In the explosion, a large amount of radioactive nickel (0.3 to 0.8 solar masses) is created which subsequently decays to iron. No remnant is left behind. The energy released by the radioactive decay powers the light curve of the supernova. Type Ia SN can be used as distance indicators since there is a strong correlation between their intrinsic brightness at maximum and the rate at which they fade. They were used to discover the accelerating expansion of the universe, and hence the presence of dark energy.
Type Ib, Type Ic and Type II SN arise from the core collapse of a massive star. The outer layers are ejected in the SN explosion while a neutron star or black hole remnant is left behind. Type II SN are the most common type of SN, and arise when a red supergiant (RSG) undergoes core collapse. Type II SN can also be used to measure distances. We have explored the accuracy of a distance-measuring technique called the expanding photosphere method. This method does not make any assumption about supernovae being standard candles — rather it relies on the expansion of the supernova to determine distances. In principle the technique is straightforward — in practice there are uncertainties because of radiation transfer effects which we are addressing with CMFGEN.
Type IIn SN represent yet another class of SN, and their spectra often exhibit very narrow lines of hydrogen superimposed on a much broader component. In one scenario a massive star undergoes a core collapse, triggering a normal SN explosion. The rapidly expanding ejecta of the SN interacts with a
slowly expanding shell of material that was ejected at an earlier epoch. In the interaction a shock is formed which converts much of the kinetic energy of the SN explosion into radiative energy, creating a very luminous SN.