 |
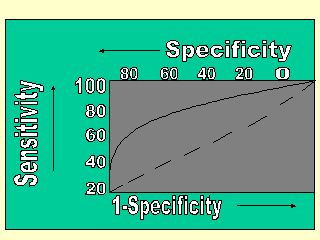
The slide represents a ROC -“Receiver, Operating
Characteristic Curve”. It combines on one picture the effect of differing
sensitivities and specificities. Specificity is shown as increasing to the left at the top
of the picture and 1- (one minus) specificity increasing to the right at the bottom. This
is the custom except that the labeling is usually on the bottom. The ROC does show that it
is usual for the sensitivity of a test to increase as the specificity decreases. The ROC
curve is best when the line is curved as shown. The dotted line shows the relationship for
a test that produced random results |
