|
Search for most
updated materials ↑

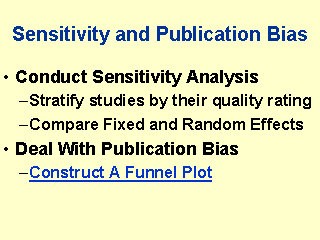
Based
on the quality of the studies you selected, divide them into two or more groups. Then,
conduct separate analyses for each group. Also, compare the results of fixed and random
effects model for the studies. A funnel plot will help you to identify presence of
publication bias. In the absence of publication bias, if a large number of studies are
compared, the distribution of the studies in the funnel plot resembles a funnel looked at
sideways with the wider end down. In the presence of publication bias, either end of the
base of the funnel will appear truncated. |
|


