| front |1 |2 |3 |4 |5 |6 |7 |8 |9 |10 |11 |12 |13 |14 |15 |16 |17 |18 |19 |20 |21 |22 |23 |24 |25 |26 |27 |28 |29 |30 |31 |32 |33 |34 |35 |36 |37 |38 |39 |40 |41 |42 |43 |44 |45 |review |
 |
The General
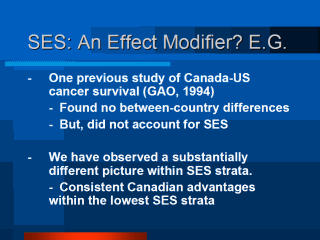
Accounting Office study compared all cancer patients in the province of
Ontario with a sample of the entire US population of such patients (4 types
of cancer over a given period of time). Such gross comparisons are akin to attempting to find a scientific/policy important needle in a hay stack. In that they aggregate the outcomes of all patients (the relatively rich and poor, those who live in large metropolitan areas to rural-remote areas, etc.) they are not capable of observing any interesting/important effects among such subgroups. |