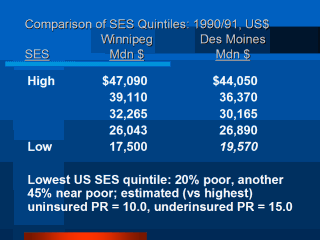
| This slide
demonstrates the between-country comparability (median household income in
census tracts) across five socioeconomic strata that typically resulted from
construction of an ecological SES variable with the previously described
method. It also tends to validate the notion that the prevalence of poor
people is very high in the lowest income strata (two-thirds are poor or near
poor [200% of federal criterion]) and that their risk of being under- or
uninsured is much greater [10- to 15-fold prevalence ratios] than among
those who live in the highest income strata.
|
