| front |1 |2 |3 |4 |5 |6 |7 |8 |9 |10 |11 |12 |13 |14 |15 |16 |17 |18 |19 |20 |21 |22 |23 |24 |25 |26 |27 |28 |29 |30 |31 |32 |33 |34 |35 |36 |37 |38 |39 |40 |41 |42 |43 |44 |45 |review |
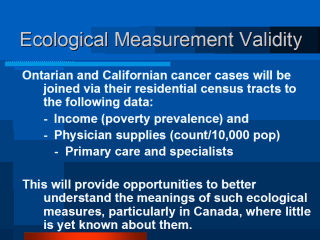 |
Socioeconomic data
(census tract profiles) is available from Statistics Canada and the US
Bureau of the Census. Physician supply data (census tract profiles) is available from the Canadian Institute for Health Information (CIHI) and the American Medical Association (AMA). Related to the second point: In contrast to our group’s findings, another group of researchers has observed small to moderate SES-cancer survival gradients in Ontario (Kingston, ON: Mackillop et al., J Clin Oncol 1997; Boyd et al., J Clin Oncol 1999). We think that their group has posed questions very different than ours (different SES variables used). Area units in our metropolitan analyses have tended to be very small poverty enclaves of around .25 km2. Whereas, in their province wide analyses, the units were often times much larger (particularly in far outlying rural areas), sometimes more than 4,000 times larger (e.g., ecological units larger than 1,000 km2). We hypothesize that the smaller units are better proxies for personal socioeconomic resources (and more predictive in American contexts), while the larger units are better proxies for community resources or regional health care service endowments (as indexed by physician supplies [and more predictive in Canadian contexts, particularly in other than large metro areas]). |