| front |1 |2 |3 |4 |5 |6 |7 |8 |9 |10 |11 |12 |13 |14 |15 |16 |17 |18 |19 |20 |21 |22 |23 |24 |25 |26 |27 |28 |29 |30 |31 |32 |33 |34 |35 |36 |37 |38 |39 |40 |41 |42 |43 |44 |45 |46 |47 |review |
 |
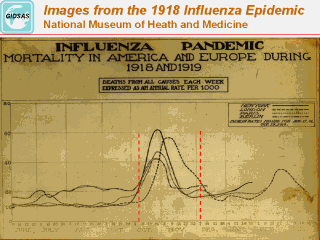
This graph shows the mortality from all causes
from June 1918 to March 1919 in New York, Paris, London & Berlin The deaths are expressed in weekly annual rate per 1,000 The first peak is observed during October and November of 1918 and the second peak is seen between February and March of 1919. Critical to note is that in all four cities the first peak appears almost at the same time – between 10 of October to 7 of December, 1918. |