| front |1 |2 |3 |4 |5 |6 |7 |8 |9 |10 |11 |12 |13 |14 |15 |16 |17 |18 |19 |20 |21 |22 |23 |24 |25 |26 |27 |28 | 29 |30 |31 |32 |33 |34 |35 |36 |37 |38 |39|40 |41 |42 |43 |44 |45 |46 |47 |review |
 |
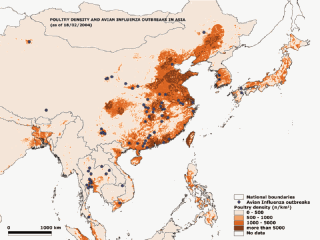
This slide looks at the relationship between
poultry density and avian influenza outbreaks in Asia. The map shows that the poultry density is directly related to avian outbreaks. Thus both, pig and poultry density play an important role in avian outbreaks in Asia. SOURCE: FAO |