| front |1 |2 |3 |4 |5 |6 |7 |8 |9 |10 |11 |12 |13 |14 |15 |16 |17 |18 |19 |20 |21 |22 |23 |24 |25 |26 |27 |28 |29 |30 |31 |32 |33 |review |
 |
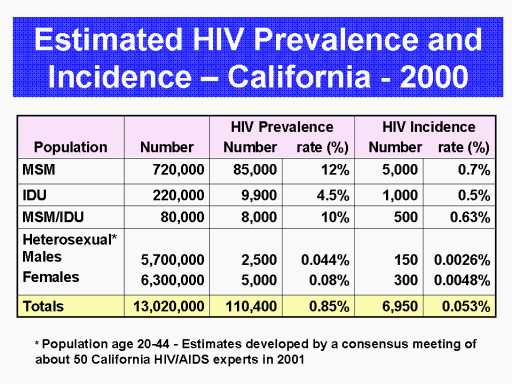
This
table presents the results of a consensus meeting of AIDS experts in
2001 to estimate HIV prevalence and incidence in California.
Using the available HIV/AIDS data, these experts developed
the “best” estimates for the sizes of and HIV prevalence and
incidence in populations at risk of HIV by different modes of HIV
transmission. These estimates
can be questioned but it is doubtful whether any critic may have any
reliable data to significantly increase or decrease any of these
estimates.
The major significance of these estimates is that in the year 2000, about 20 to 25 years after HIV probably began to spread in high risk populations (MSM and IDU) in the State, HIV had remained essentially confined within the major risk populations – MSM and IDU. Nevertheless, AIDS alarmists continue to sound dire warnings that HIV has been “on the brink” of “bridging” into the “general” population of heterosexuals from infected IDU or bisexuals for the past couple of decades! It is difficult for most AIDS advocates and activists to accept the reality that the patterns and prevalence of sexual risk behaviors in most general populations are insufficient to start or sustain epidemic (R0 >1) heterosexual HIV transmission. |