| front |1 |2 |3 |4 |5 |6 |7 |8 |9 |10 |11 |12 |13 |14 |15 |16 |17 |18 |19 |20 |21 |22 |23 |24 |25 |26 |27 |28 |29 |30 |31 |32 |33 |34 |35 |36 |37 |38 |39 |40 |41 |42 |43 |44 |45 |46 |47 |48 |review |
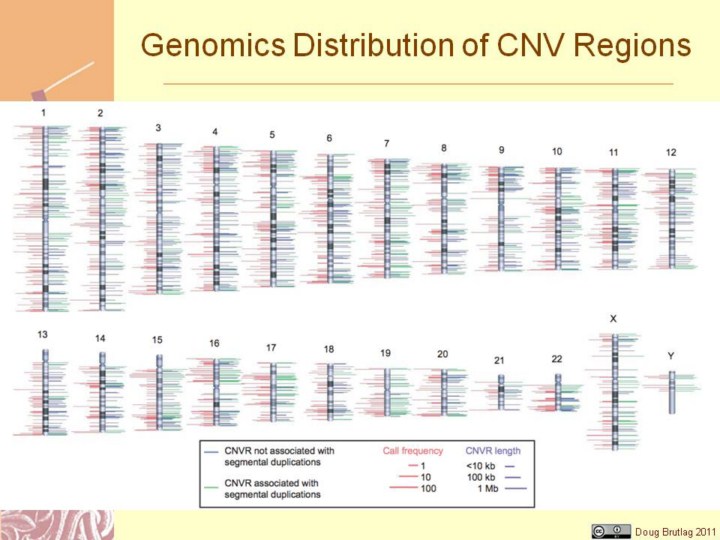 |
Figure 4 | Genomic distribution of CNVRs. The chromosomal locations of 1,447 CNVRs are indicated by lines to either side of ideograms. Green lines denote CNVRs associated with segmental duplications; blue lines denote CNVRs not associated with segmental duplications. The length of right- hand side lines represents the size of each CNVR. The length of left-hand side lines indicates the frequency that a CNVR is detected (minor call frequency among 270 HapMap samples). When both platforms identify a CNVR, the maximum call frequency of the two is shown. For clarity, the dynamic range of length and frequency are log transformed (see scale bars). All data can be viewed at the Database of Genomic Variants (http://projects.tcag.ca/ variation/).
|