| front |1 |2 |3 |4 |5 |6 |7 |8 |9 |10 |11 |12 |13 |14 |15 |16 |17 |18 |19 |20 |21 |22 |23 |24 |25 |26 |27 |28 |29 |30 |31 |32 |33 |34 |35 |36 |37 |38 |39 |40 |41 |42 |43 |44 |45 |46 |review |
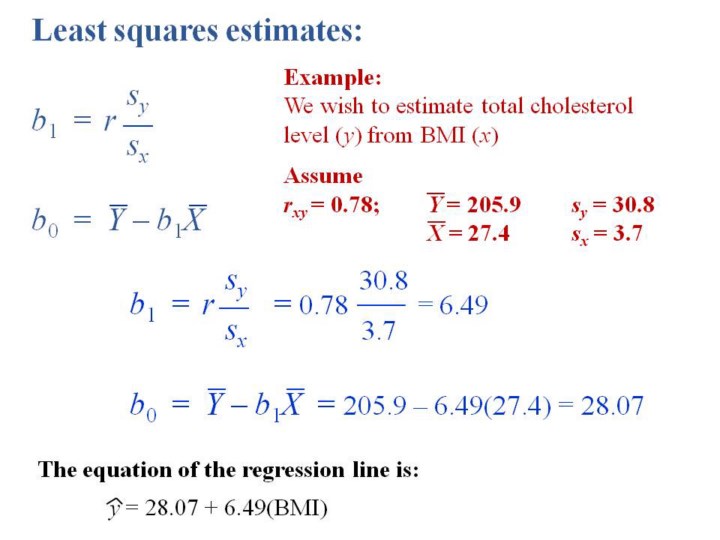 |
1.Here
is an example of “least squares” regression being used to predict total
cholesterol level (“y”) from body mass index (“x”).
2.In
this example, we provide the correlation coefficient (r) between total
cholesterol level and body mass index in order to calculate the b1 term.
3.Notice
the equation of the regression line. The constant, b0, is the
theoretical value of total cholesterol when the “x” variable, body mass
index, is zero.
4.However,
since body mass index cannot be zero, the b0 term is purely theoretical
and is used as constant to generate predicted values of total
cholesterol based on body mass index.
|