| front |1 |2 |3 |4 |5 |6 |7 |8 |9 |10 |11 |12 |13 |14 |15 |16 |17 |18 |19 |20 |21 |22 |23 |24 |25 |26 |27 |28 |29 |30 |31 |32 |33 |34 |35 |36 |37 |38 |39 |40 |41 |42 |43 |44 |45 |46 |review |
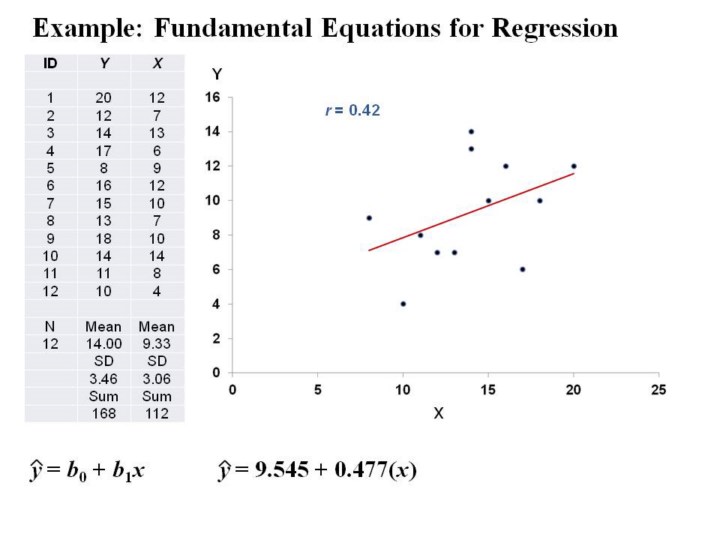 |
1.Here
is an example of a modest relationship between a predictor (“x”) and
outcome (“y”) variable.
2.The
regression equation is listed to show the best fitting line, and the
extent to which actual values deviate from the prediction line (known as
the residuals).
|