| front |1 |2 |3 |4 |5 |6 |7 |8 |9 |10 |11 |12 |13 |14 |15 |16 |17 |18 |19 |20 |21 |22 |23 |24 |25 |26 |27 |28 |29 |30 |31 |32 |33 |34 |35 |36 |37 |38 |39 |40 |41 |42 |43 |44 |45 |46 |review |
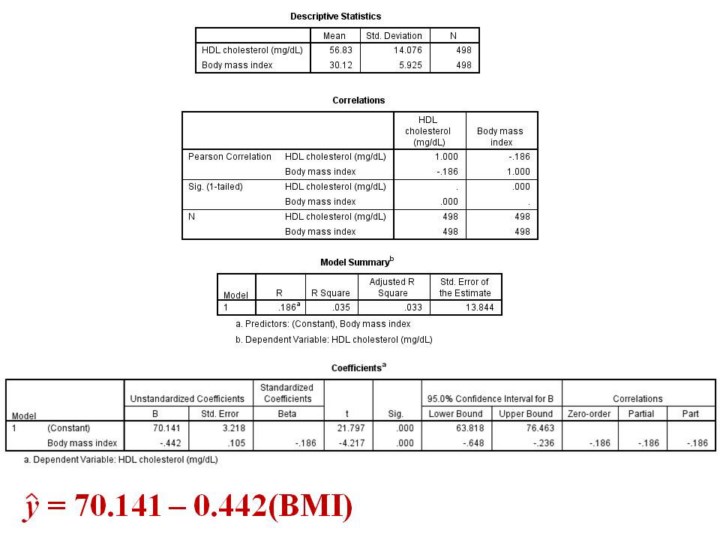 |
1.In
this example, body mass index is a significant predictor of HDL
cholesterol level, with a t-value of -4.217 and p-value < 0.0001.
2.The
linear regression equation is written from the 2 beta coefficients – the
constant (intercept) term, and the B1 value for body mass index as a
predictor of HDL cholesterol level.
|