 |
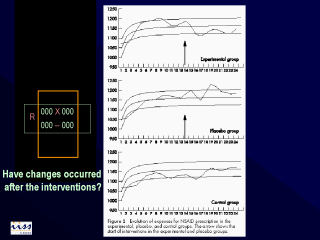
A time series adjusted curve of the cost per prescription for
each group and its confidence intervals was thus plotted, and the post-intervention
changes registered in the groups were projected on this adjusted curve. The reduction in
the cost per prescription (cost of average package during the six months after the
intervention, minus the cost of average package during the six previous months, divided by
the latter) between the periods prior and post-intervention was also calculated for each
of the groups, with their respective confidence intervals of 95%. |
