| front |1 |2 |3 |4 |5 |6 |7 |8 |9 |10 |11 |12 |13 |14 |15 |16 |17 |18 |19 |20 |21 |22 |23 |24 |25 |26 |27 |28 |29 |30 |review |
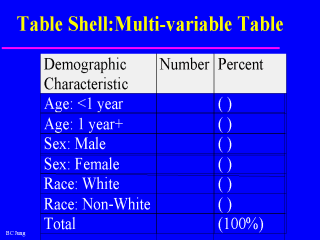 |
A table shell is a template used to organize data. As part
of the analysis plan, it shows how the data will be organized and displayed. Include
titles, headings, categories. This is an example of a two variable table. Disease status (Ill, Well) is usually noted along the top of the table (x-axis). Exposure status (Exposed, Unexposed) is along the side (y-axis). |