| front |1 |2 |3 |4 |5 |6 |7 |8 |9 |10 |11 |12 |13 |14 |15 |16 |17 |18 |19 |20 |21 |22 |23 |24 |25 |26 |27 |28 |29 |30 |review |
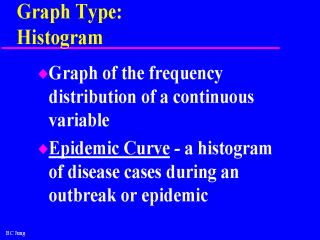 |
Though a histogram looks like a bar graph, it differs by
the fact that all the bars are adjoining. The use of adjoining columns represent the number of observations for each class interval in the distribution. The area of each column is proportional to the number of observations in that interval. Since all class intervals are equal, the height of each column is
proportional to the number of observations it shows. |