| front |1 |2 |3 |4 |5 |6 |7 |8 |9 |10 |11 |12 |13 |14 |15 |16 |17 |18 |19 |20 |21 |22 |23 |24 |25 |26 |27 |28 |29 |30 |31 |32 |33 |34 |35 |36 |37 |38 |39 |40 |41 |42 |43 |44 |45 |46 |47 |48 |49 |50 |51 |52 |53| 54 |55|review |
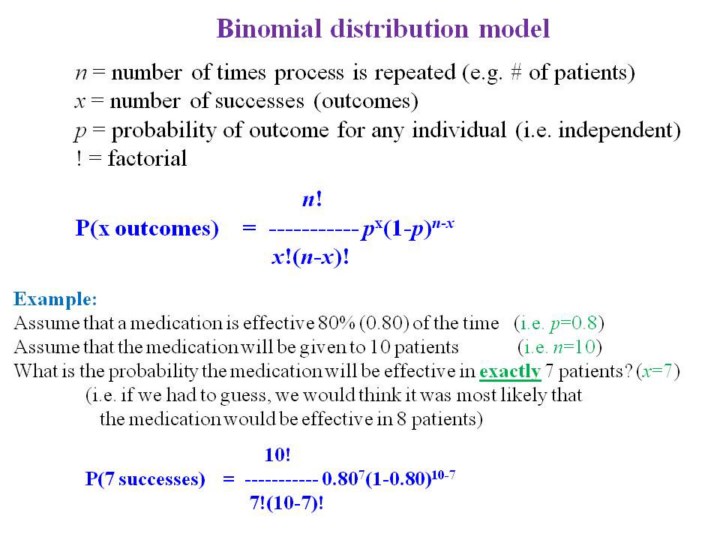 |
1.To
calculate
a probability using the binomial distribution model that, by definition
ranges from 0 to 1.0, we need 3 pieces of information as depicted in the
formula.
2.In
this example, we need to know the probability of the outcome for a given
individual, denoted “p”.
3.We
need to know how many times (or patients) the process will be repeated,
denoted “n”.
4.And
we need to know the quantity (i.e. number of outcomes) that we want to
estimate, denoted “x”.
|