| front |1 |2 |3 |4 |5 |6 |7 |8 |9 |10 |11 |12 |13 |14 |15 |16 |17 |18 |19 |20 |21 |22 |23 |24 |25 |26 |27 |28 |29 |30 |31 |32 |33 |34 |35 |36 |37 |38 |39 |40 |41 |42 |43 |44 |45 |46 |47 |48 |49 |50 |51 |52 |53 |54 |55 |review |
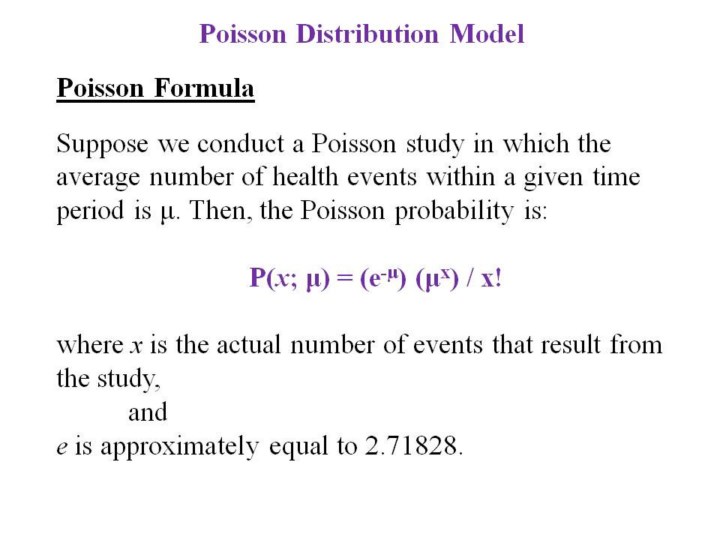 |
1.Here
is the formula for the poisson
distribution model. While it may look unwieldy, it is actually
straightforward.
2.As
seen in the formula, the pieces of information needed are the number of
average events for a given time period, denoted as “μ”,
the estimated probability of observing a certain
number of events, denoted as “x”,
and base “e”
which is a constant approximately equal to 2.71828.
|