| front |1 |2 |3 |4 |5 |6 |7 |8 |9 |10 |11 |12 |13 |14 |15 |16 |17 |18 |19 |20 |21 |22 |23 |24 |25 |26 |27 |28 |29 |30 |31 |32 |33 |34 |35 |36 |37 |38 |39 |40 |41 |42 |43 |44 |45 |46 |47 |48 |49 |50 |51 |52 |53 |54 |55 |review |
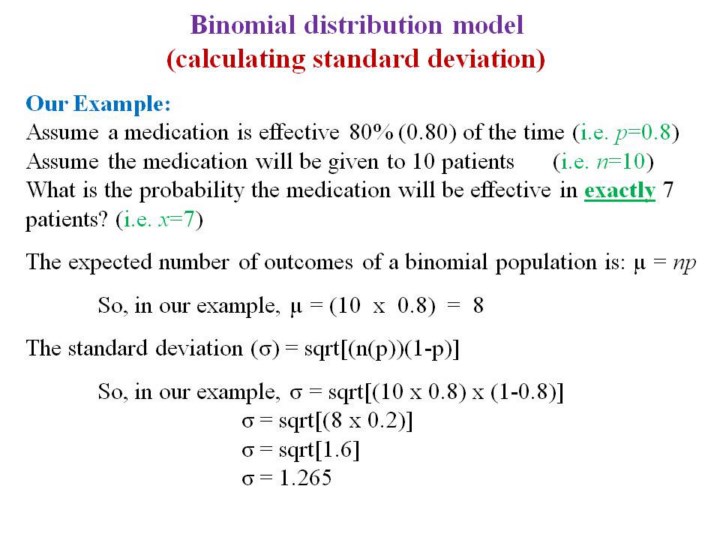 |
1.When
we calculate
a probability from the binomial distribution model, we can also estimate
the standard deviation using the formula listed on this slide.
2.You
will notice it uses the terms “p”
and “q”
which denote the probability of the outcome occurring and the
complementary probability of the outcome not occurring in a given
individual.
|