| front |1 |2 |3 |4 |5 |6 |7 |8 |9 |10 |11 |12 |13 |14 |15 |16 |17 |18 |19 |20 |21 |22 |23 |24 | 25|26 |27 |28 |29 |30 |31 |32 |33 |34 |35 |36 |37 |38 |39 |40 |41 |42 |43 |44 |45 |46 |47 |48 |49 |50 |51 |52 |53 |54 |55 |review |
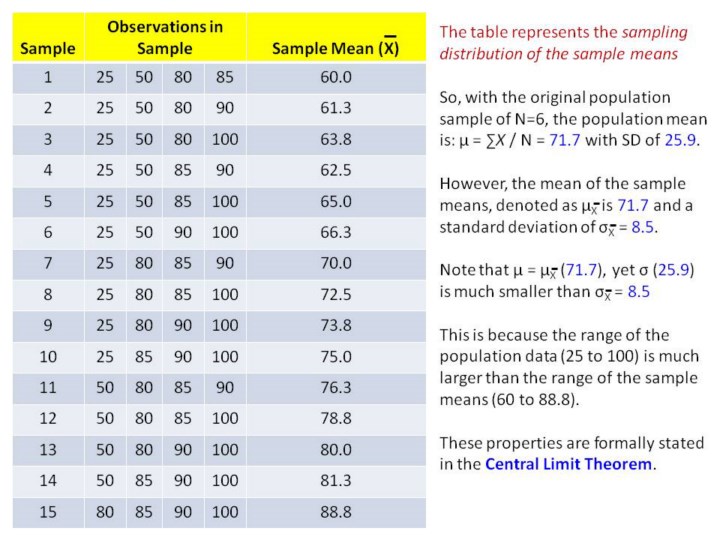 |
1.This
slides shows all possible combinations in which 4 observations for the
total population (n=6) could be drawn. They are rank-ordered from the
lowest to highest possible mean.
2.Notice
how the range of sample means (60.0 to 88.8 is much smaller than the
range of values in the population (25 to 100).
3.These
properties are stated in the central limit theorem.
|