| front |1 |2 |3 |4 |5 |6 |7 |8 |9 |10 |11 |12 |13 |14 |15 |16 |17 |18 |19 |20 |21 |22 |23 |24 |25 |26 |27 |28 |29 |30 |31 |32 |33 |34 |35 |36 |37 |38 |39 |40 |41 |42 |43 |44 |45 |46 |47 |48 |49 |50 |51 |52 |53 |54 |55 |review |
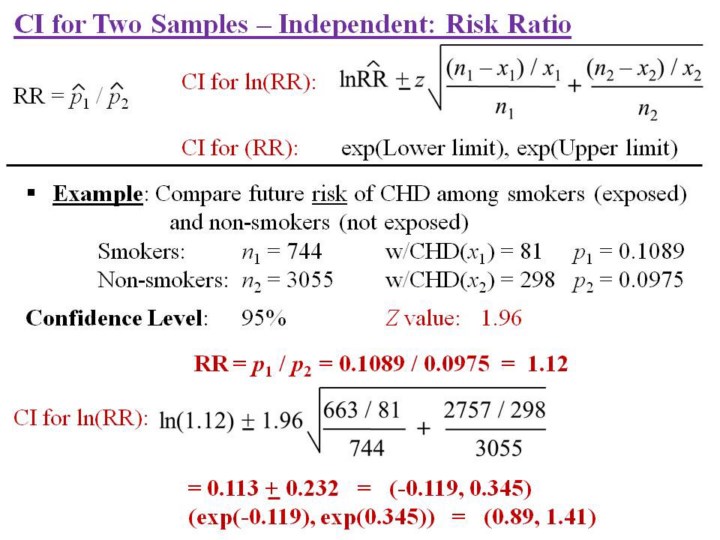 |
1.In
this example, we want to calculate a 95% confidence interval for the
risk ratio, meaning the ratio of the 2 incidence proportions.
2.The
outcome of interest is the interest of coronary heart disease (CHD), and
the groups being compared are smokers versus non-smokers.
3.After
calculating the confidence interval in the natural logarithm scale, the
values are transformed by exponentiation (e.g. the function “exp” on
your calculator or in Excel).
4.In
this example, smokers appear to be at higher risk of developing CHD
(risk ratio of 1.12), but the 95% confidence interval of 0.89 to 1.41
includes the possibility of either lower or higher risk associated with
smoking.
|