| front |1 |2 |3 |4 |5 |6 |7 |8 |9 |10 |11 |12 |13 |14 |15 |16 |17 |18 |19 |20 |21 |22 |23 |24 |25 |26 |27 |28 |29 |30 |31 |32 |33 |34 |35|36 |37 |38 |39 |40 |41 |42 |43 |44 |45 |46 |47 |48 |49 |50 |51 |52 |53 | 54 |55 |review |
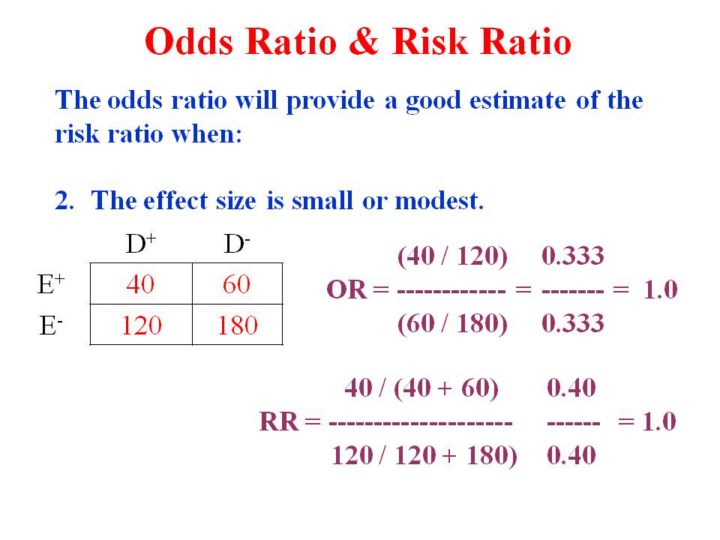 |
1. This slide illustrates that even if the disease or health outcome is not rare, the odds ratio and risk ratio estimate may be identical or similar depending on the effect size.
|