| front |1 |2 |3 |4 |5 |6 |7 |8 |9 |10 |11 |12 |13 |14 |15 |16 |17 |18 |19 |20 |21 |22 |23 |24 |25 |26 |27 |28 |29 |30 |31 |32 |33 |34 |35|36 |37 |38 |39 |40 |41 |42 |43 |44 |45 |46 |47 |48 |49 |50 |51 |52 |53 |54 |55| |
 |
If you have any comments or questions, please send a
message to
super1@pitt.edu
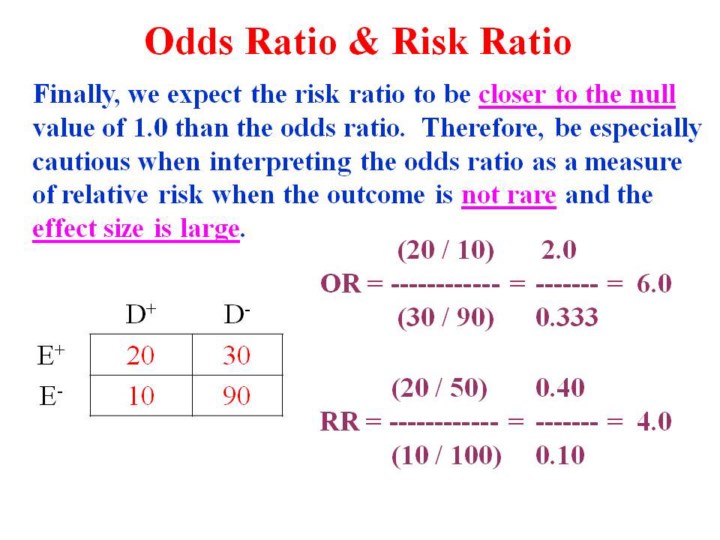
1.The
risk ratio will be equal to or closer to the null value of 1.0 than the
odds ratio.
2.Therefore,
if the disease is not rare and the effect size is not small or modest,
it is best to interpret the odds ratio literally, and not as a close
approximation to the risk ratio.
Go to Part 2 of this lecture http://www.pitt.edu/~super1/lecture/lec51731/index.htm
|
Search inside of Supercourse and lectures in HTML or PPT format