| front |1 |2 |3 |4 |5 |6 |7 |8 |9 |10 |11 |12 |13 |14 |15 |16 |17 |18 |19 |20 |21 |22 |23 |24 |25 |26 |27 |28 |29 |30 |31 |32 |33 |34 |35 |36 |37 |38 |39 |40 |41 |42 |43 |44 |45 |46 |47 |48 |49 |50 |51 |52 |53 |54 |55 |review |
 |
1.Similar
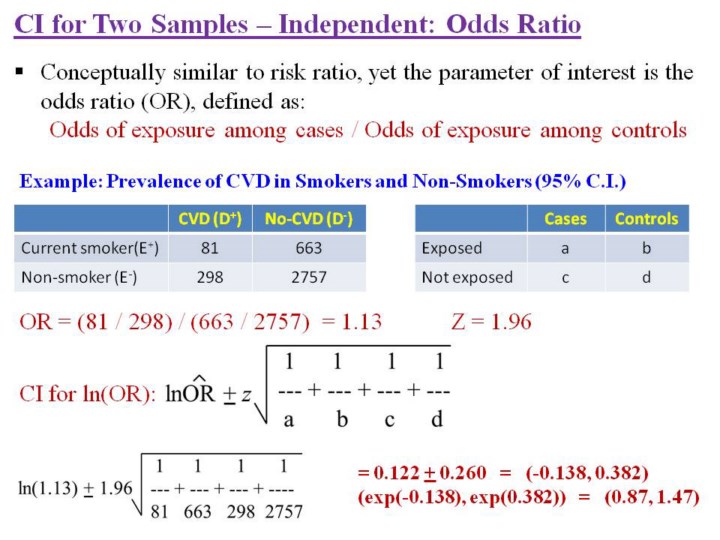
to the risk ratio, here are the guidelines for calculating a confidence
interval for 2 independent samples and the odds ratio as the parameter
of interest.
2.Note
that calculation of the confidence interval requires the additional step
of performing a calculation in natural logarithm scale, and then doing a
transformation.
3.In
this example, the 95% confidence interval for the odds ratio ranges from
0.87 to 1.47.
4.Since
the 95% confidence interval includes the null value of 1.0, it is
plausible (from these data) that smokers are at either lower or higher
risk of cardiovascular disease (CVD) compared to non-smokers.
|