| front |1 |2 |3 |4 |5 |6 |7 |8 |9 |10 |11 |12 |13 |14 |15 |16 |17 |18 |19 |20 |21 |22 |23 |24 |25 |26 |27 |28 |29 |30 |31 |32 |33 |34 |35 |36 |37 |38 |39 |40 |41 |42 |43 |44 |45 |46 |47 |48 |49 |50 |51 |52 |review |
 |
1.Now
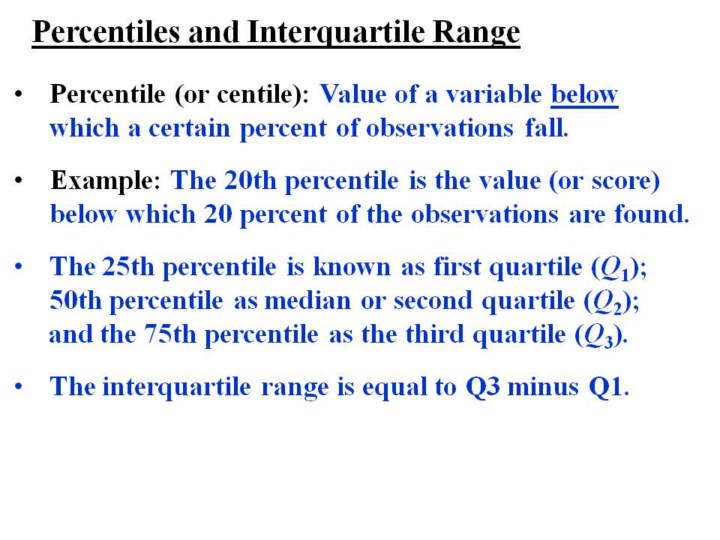
we need to take a look at percentiles which reflect a value in the
sample distribution (such as age) in which a certain percentage of
observations.
2.Many
published health research papers present data using percentiles, such as
comparing disease outcomes by groups above or below a certain
percentile, or between multiple groups such as tertiles (3 groups),
quartiles (4 groups), and quintiles (5 groups).
|