| front |1 |2 |3 |4 |5 |6 |7 |8 |9 |10 |11 |12 |13 |14 |15 |16 |17 |18 |19 |20 |21 |22 |23 |24 |25 |26 | 27|28 |29 |30 |31 |32 |33 |34 |35 |36 |37 |38 |39 |40 |41 |42 |43 |44 |45 |46 |47 |48 |49 |50 |51 |52 |review |
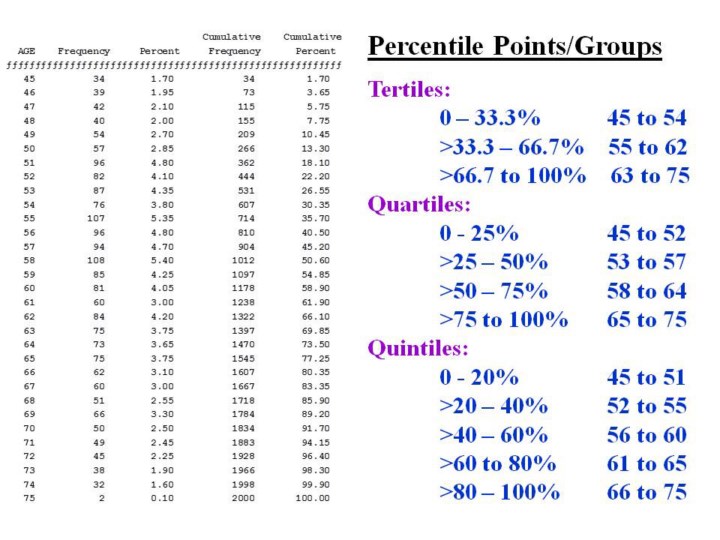 |
1.This
is a frequency distribution of age taken from an SPSS dataset similar to
the one that you will be using.
2.You
use the “cumulative percent” column on the far right to determine the
break points for each category, whether it be for tertiles, quartiles,
or quintiles.
|