| front |1 |2 |3 |4 |5 |6 |7 |8 |9 |10 |11 |12 |13 |14 |15 |16 |17 |18 |19 |20 |21 |22 |23 |24 |25 |26 |27 |28 |29 |30 |31 |32 |33 |34 |35|36 |37 |38 |39 |40 |41 |42 |43 |44 |45 |46 |47 |48 |49 |50 |51 |52|review |
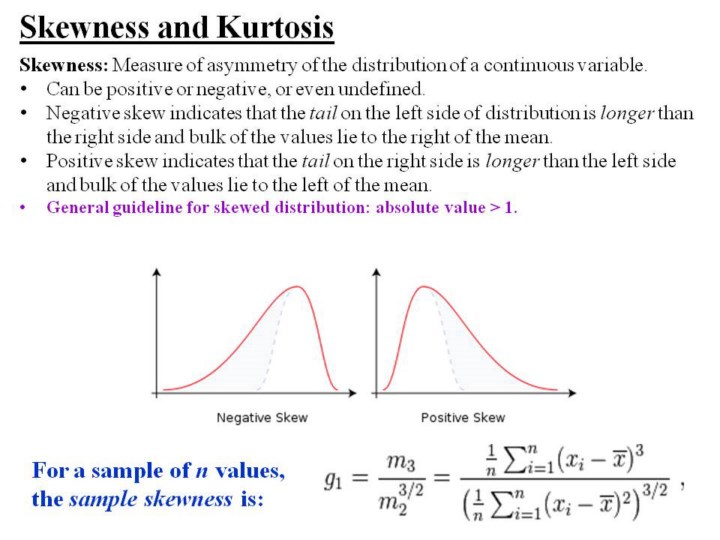 |
1.Measures
of skewness and kurtosis are frequently calculated and plotted to show
the shape of the distribution of a continuous variable, such as
triglycerides.
2.Evaluation
of skewness is very important for statistical hypothesis testing. It
helps define which type of statistical test to use, or sometimes,
whether to transform values of a variable.
3.When
you look at the formula, you can appreciate that this is rarely
calculated by hand, instead, relying on computer software.
|