| front |1 |2 |3 |4 |5 |6 |7 |8 |9 |10 |11 |12 |13 |14 |15 |16 |17 |18 |19 |20 |21 |22 |23 |24 |25 |26 |27 |28 |29 |30 |31 |32 |33 |34 |35|36 |37 |38 |39 |40 |41 |42 |43 |44 |45 |46 |47 |48 |49 |50 |51 |52 |52| |
 |
If you have any comments or questions, please send a
message to
super1@pitt.edu
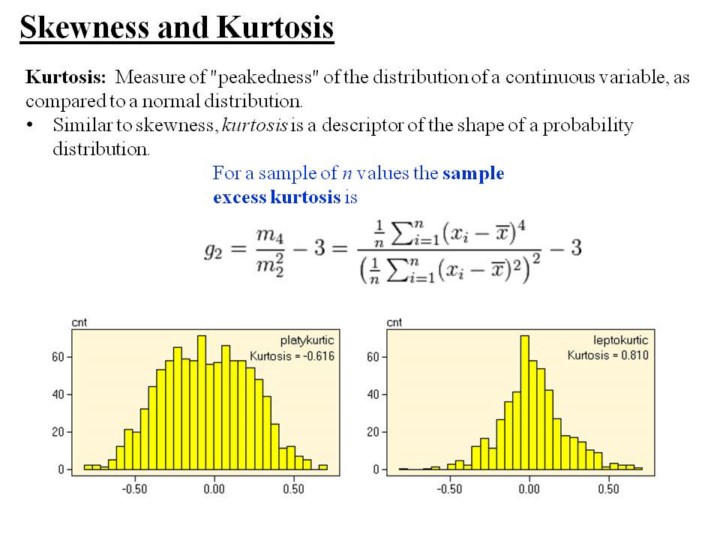
1.Kurtosis
shows the “peakedness” of the distribution of a continuous variable.
2.When
you look at the formula, you can appreciate that this is rarely
calculated by hand, instead, relying on computer software.
Go to Part II of this lecture
|
Search inside of Supercourse and lectures in HTML or PPT format