| front |1 |2 |3 |4 |5 |6 |7 |8 |9 |10 |11 |12 |13 |14 |15 |16 |17 |18 |19 |20 |21 |22 |23 |24 |25 |26 |27 |28 |29 |30 |31 |32 |33 |34 |35 |36 |37 |38 |39 |40 |41 |42 |43 |44 |45 |46 |47 |48 |49 |50 |51 |52 |53 |54 |55 |56 |57 |58 |59 |60 |61 |62 |63 |64 |65 |66 |67 |68 |review |
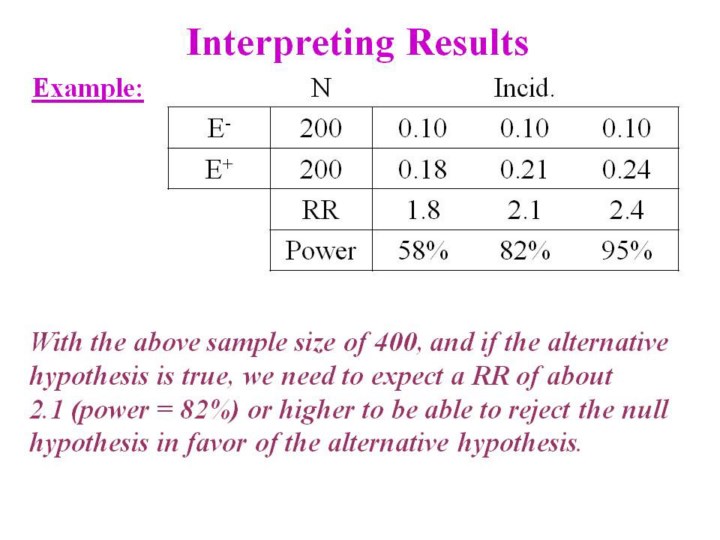 |
1. This table illustrates that given the same sample size, the power to reject the null hypothesis of no association is higher as the relative risk (RR) departs from the null value of 1.0. |