| front |1 |2 |3 |4 |5 |6 |7 |8 |9 |10 |11 |12 |13 |14 |15 |16 |17 |18 |19 |20 |21 |22 |23 |24 |25 |26 |27 |28 |29 |30 |31 |32 |33 |34 |35|36 |37 |38 |39 |40 |41 |42 |43 |44 |45 |46 |47 |48 |49 |50 |51 |52 |53 |54 |55 |56 |57 |58 |59 |60 |61 |62 |63 |64 |65 |66 |67 |68 |review |
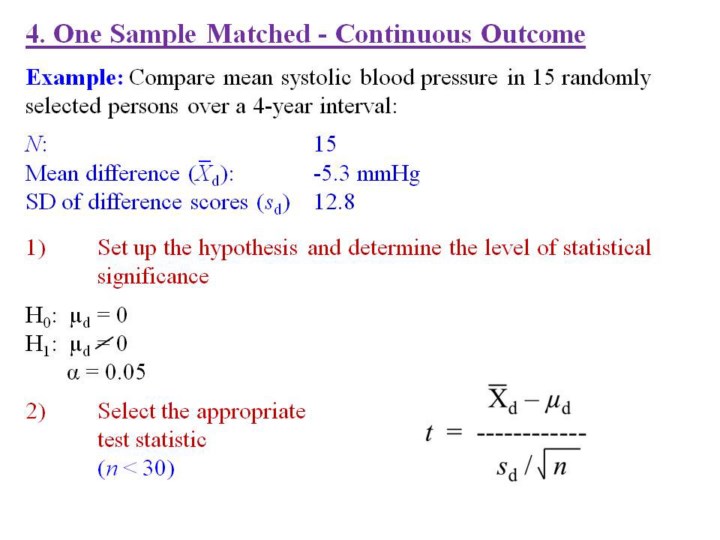 |
1.In
this example, we seek to compare mean systolic blood pressure at an
entry time and then 4 years later.
2.The
null hypothesis is that the mean difference between the 2 time points is
0.
3.Since
the sample size is less than 30, we need to use the
t
statistic.
|