| front |1 |2 |3 |4 |5 |6 |7 |8 |9 |10 |11 |12 |13 |14 |15 |16 |17 |18 |19 |20 |review |
 |
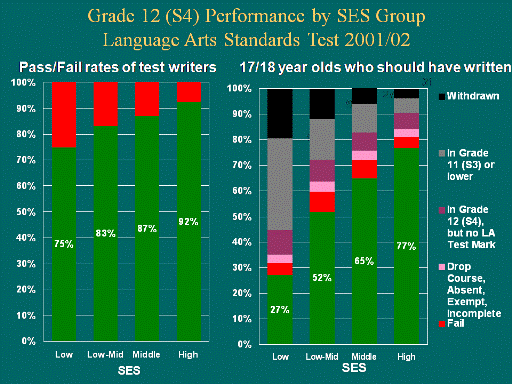
LEGEND Green = Pass Pink = Drop course, Absent, Exempt, Incomplete Grey = In Grade 11 (S3) or lower Red = Fail Purple = In Grade 12 (S4) but no LA Test Mark Black = Withdrawn
How much do educational outcomes differ across socioeconomic levels? We compared performance on the Grade 12 language arts standards tests by Winnipeg socioeconomic area. The graph on the left reflects what the schools see when they review the performance of students taking the tests: 92 % of students living in the high-SES areas passed, along with 75 % of those living in low SES areas. These numbers do not tell the whole story, however; they just report results for those who are in school that day, in Grade 12 and writing the standards test.
The larger question is: What happens when we focus on who should have been writing the standards test at that time? The second graph on the right tells a very different story. To develop this graph we used a cohort of children born in Manitoba in 1984 who remained in Manitoba until 2001-02. We determined where they were in the school system at that time (that is during what should have been their final year in school) identifying those who were in school but had not made it to Grade 12 yet, and those who were in Grade 12 but for a variety of reasons (absence, dropped course etc.) did not take the test. We also identified those who had withdrawn from school (not attended for two years). This showed a very different reality: only 27 % of youth living in low-SES areas who should have been writing the test that year actually wrote and passed the test. The on-time pass rate was over two-and-a-half times higher for students in the high-SES group (77 %). |