 |
When we look at our global measures of health at birth (birth weight and
Apgar scores), there are very few differences across SES. However, health
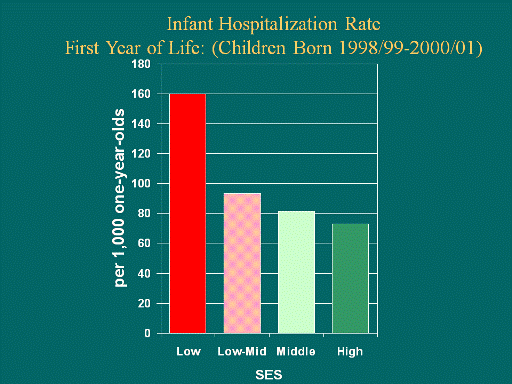
differences do emerge very early on in a child’s life. This graph shows the
hospitalization rates in the first year of life across the SES groups. This
graph demonstrates a very steep gradient, illustrating that children
resident in the lower SES neighborhoods are at much greater risk of
developing a health problem serious enough to have them admitted to hospital.
In other work we have established that the acuity of admissions among those
from low SES neighborhoods is at least as high as among those from high SES
neighborhoods. This graph when combined with our previous work on acuity
illustrates that the health care system is needs based, delivering care to
those who need it most.
|
