| front |1 |2 |3 |4 |5 |6 |7 |8 |9 |10 |11 |12 |13 |14 |15 |16 |17 |18 |19 |20 |21 |22 |23 |24 |25 |26 |27 |28 |29 |30 |31 |32 |33 |34 |35 |36 |37 |38 |39 |40 |41 |42 |43 |44 |45 |46 |47 |48 |49 |50 |51 |52 |53 |54 |55 |56 |57 |58 |59 |60 |61 |62 |63 |64 |65 |review |
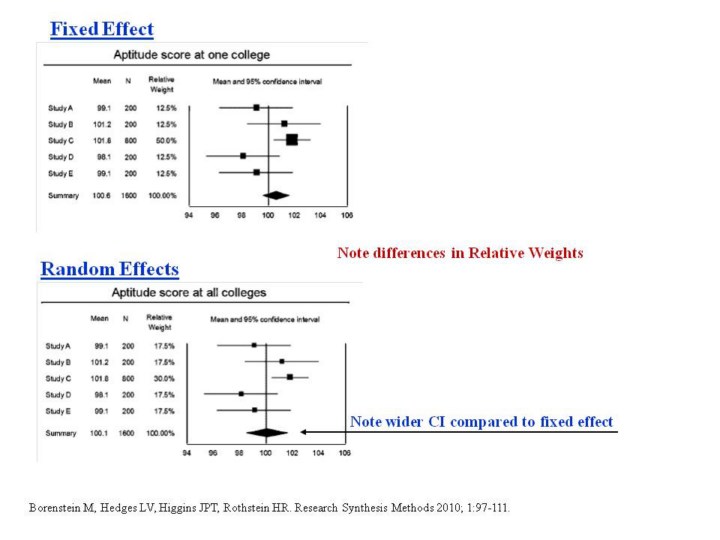 |
1.Here
is a graphic depiction of results using the fixed effect and random
effects methods.
2.Note
how the relative weights for the individual studies differ across the 2
methods of analysis.
3.Borenstein
M, Hedges LV, Higgins JPT, Rothstein HR. Research Synthesis Methods
2010; 1:97-111.
|