| front |1 |2 |3 |4 |5 |6 |7 |8 |9 |10 |11 |12 |13 |14 |15 |16 |17 |18 |19 |20 |21 |22 |23 |24 |25 |26 |27 |28 |29 |30 |31 |32 |33 |34 |35|36 |37 |38 |39 |40 |41 |42 |43 |44 |45 |46 |47 |48 |49 |50 |51 |52 |53 |54 |55 |56 |57 |58 |59 |60 |61 |62 |63 |64 |65 |review |
 |
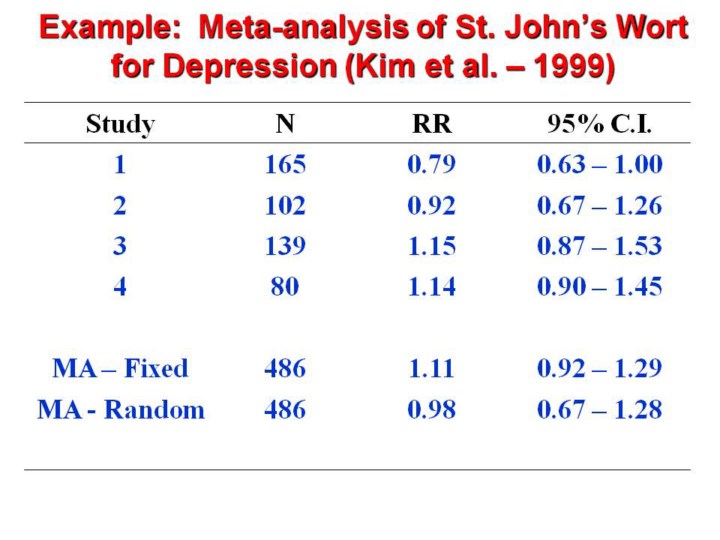
1.Both
the fixed effect and random effects relative risk estimates are near
1.0, suggesting that both approaches result is similar clinical
response.
2.Notice
that the width of the confidence interval is wider for the random
effects calculation, due to inclusion of both “within-study” and
“between-study” variance.
|